Cloudflare’s analytics, logs and traces used to live in several places, and many of them changed in late September 2026 during Cloudflare’s Birthday Week: a unified Logs view, Cloudflare Traces (open beta), a unified SQL API, Custom Alerts (beta), and Logpush on every plan.
This post is a map: which tool answers which question, and where to find it. Beta features can change; when this page and the docs disagree, the docs win.
The Map
| I WANT TO… | GO TO | NOTES |
|---|---|---|
| See traffic, cache, origin and DNS trends for a domain | Domain > Analytics (Requests, Visitors, Performance, Security, Cache, Origin, DNS) | Sampled. At least 30 days on every plan. |
| See analytics across all domains | Observability > Analytics | Account level. |
| See every request, unsampled | Observability > Logs (select Log Explorer dataset) | Paid add-on. Data only from when a dataset is enabled. |
| Know why a request was blocked, rewritten or slow | Log Explorer, Cloudflare Traces, Security Events | Find specific Requests by Ray ID. |
| Debug a Worker | Compute > Workers & Pages > your Worker > Observability | Logs, traces and Issues. Alternatively, use Local Explorer. |
| Investigate Zero Trust users and devices | Zero Trust > Insights & Logs | Logs, Analytics, Digital experience (DEX); incl. MCP Server for DEX. |
| Query from code, a Worker or an agent | SQL API, cf sql query, Workers binding, GraphQL API | One SQL dialect across analytics and logs. See Query from Code. |
| Get alerted on my own metric | Custom Alerts | Threshold, anomaly or SLO on a SQL query. |
| Send logs to a SIEM or bucket | Logpush, OpenTelemetry export | Logpush is now available on all plans. Cannot backfill. |
| See who changed a setting | Audit Logs | Also queryable as audit_logs_v2 in Log Explorer. |
| Check what I will be billed | Manage Account > Billing > Billable Usage | Pay-as-you-go accounts. See Usage vs. Billed Usage. |
Analytics are usually sampled, logs are not. Dashboards, GraphQL and the SQL API’s events.* datasets use adaptive sampling and are right for trends; their counts and sums are already sample-weighted estimates. Log Explorer datasets (logs.* in the SQL API) keep every event and are right for exact counts or a single request (depending on your configured filters). Traces are head-sampled at the rate you set.
Post-Quantum (PQC) Usage
| QUESTION | WHERE |
|---|---|
| How much of my visitor traffic uses post-quantum key agreement? | Observability > Logs (select http_requests Log Explorer dataset) > field ClientTLSKeyExchangeGroup |
| Does Cloudflare reach my origin with post-quantum key agreement? | OriginTLSKeyExchangeGroup in the http_requests Logpush dataset |
| Does a given host support it? What is global adoption? | Cloudflare Radar host test and statistics, also via the Radar API |
| Which Cloudflare products are post-quantum today? | PQC in Cloudflare products, including the Cloudflare One Client, Mesh, Tunnel, IPsec and Gateway |
Field values: X25519MLKEM768 is post-quantum (X25519Kyber768Draft00 is its obsolete draft predecessor and still shows up from older clients); X25519, P-256 or another named group is classical; UNK means unknown (on the origin field, also no origin connection, such as a cache hit); NONE means RSA key exchange or no TLS.
Per-zone share in Log Explorer:
SELECT ClientTLSKeyExchangeGroup, COUNT(*) AS requests
FROM http_requests
GROUP BY ClientTLSKeyExchangeGroup
ORDER BY requests DESC
LIMIT 10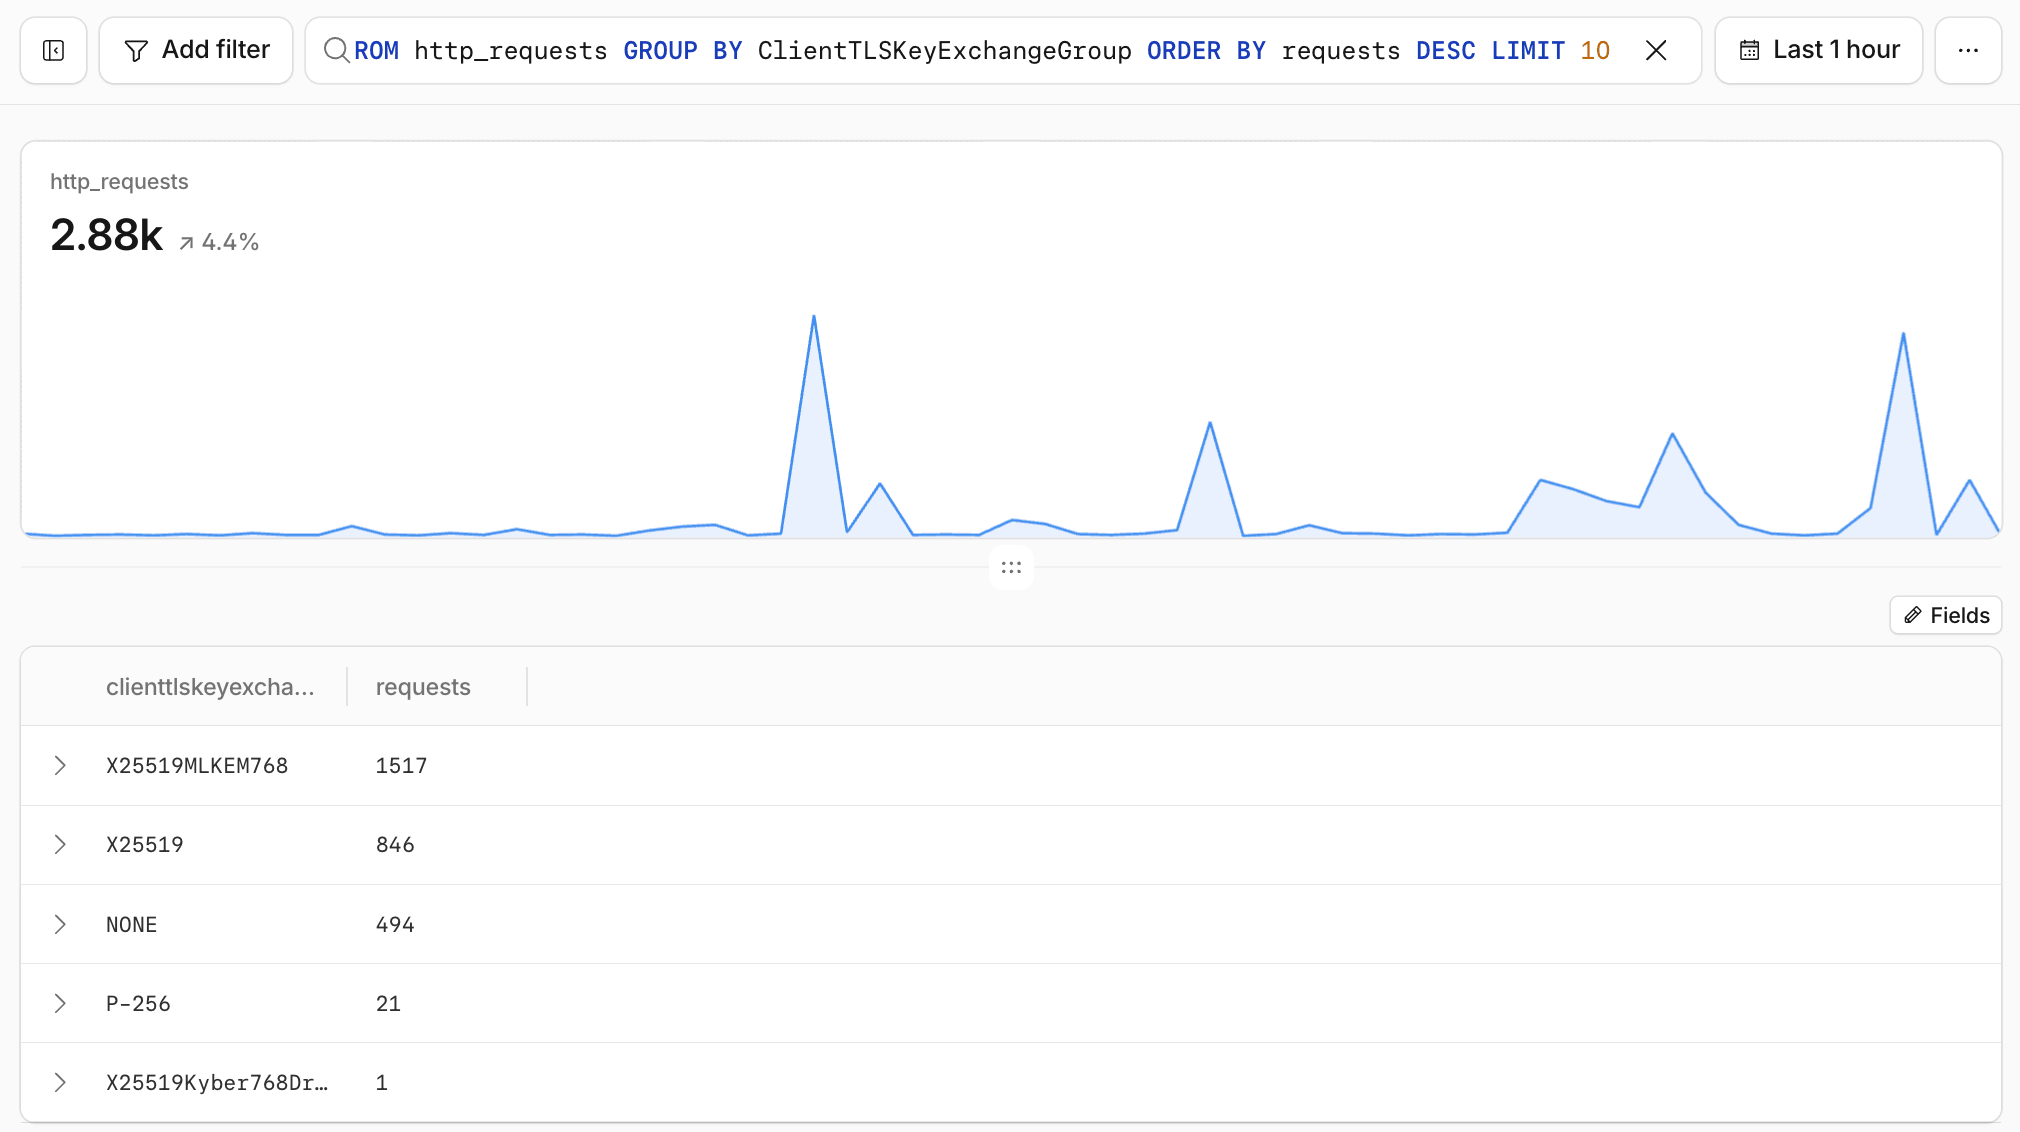 Cloudflare dashboard, Observability > Logs:
 http_requests grouped by ClientTLSKeyExchangeGroup.
The dashboard’s time picker sets the time range, and the chart shows the dataset’s event volume over it; the query result is the table below the chart. Through the API, add a date filter, as in the curl example further below.
Add ClientRequestUserAgent to the GROUP BY and filter out X25519MLKEM768 to find which clients still negotiate classical key exchange. For the origin leg, run the same aggregation on OriginTLSKeyExchangeGroup in your Logpush destination, excluding 'UNK'. Background on the algorithms: Post-Quantum Cryptography (PQC).
CDN Usage: Requests and Data Transfer
For trends, Domain > Analytics > Requests is enough.
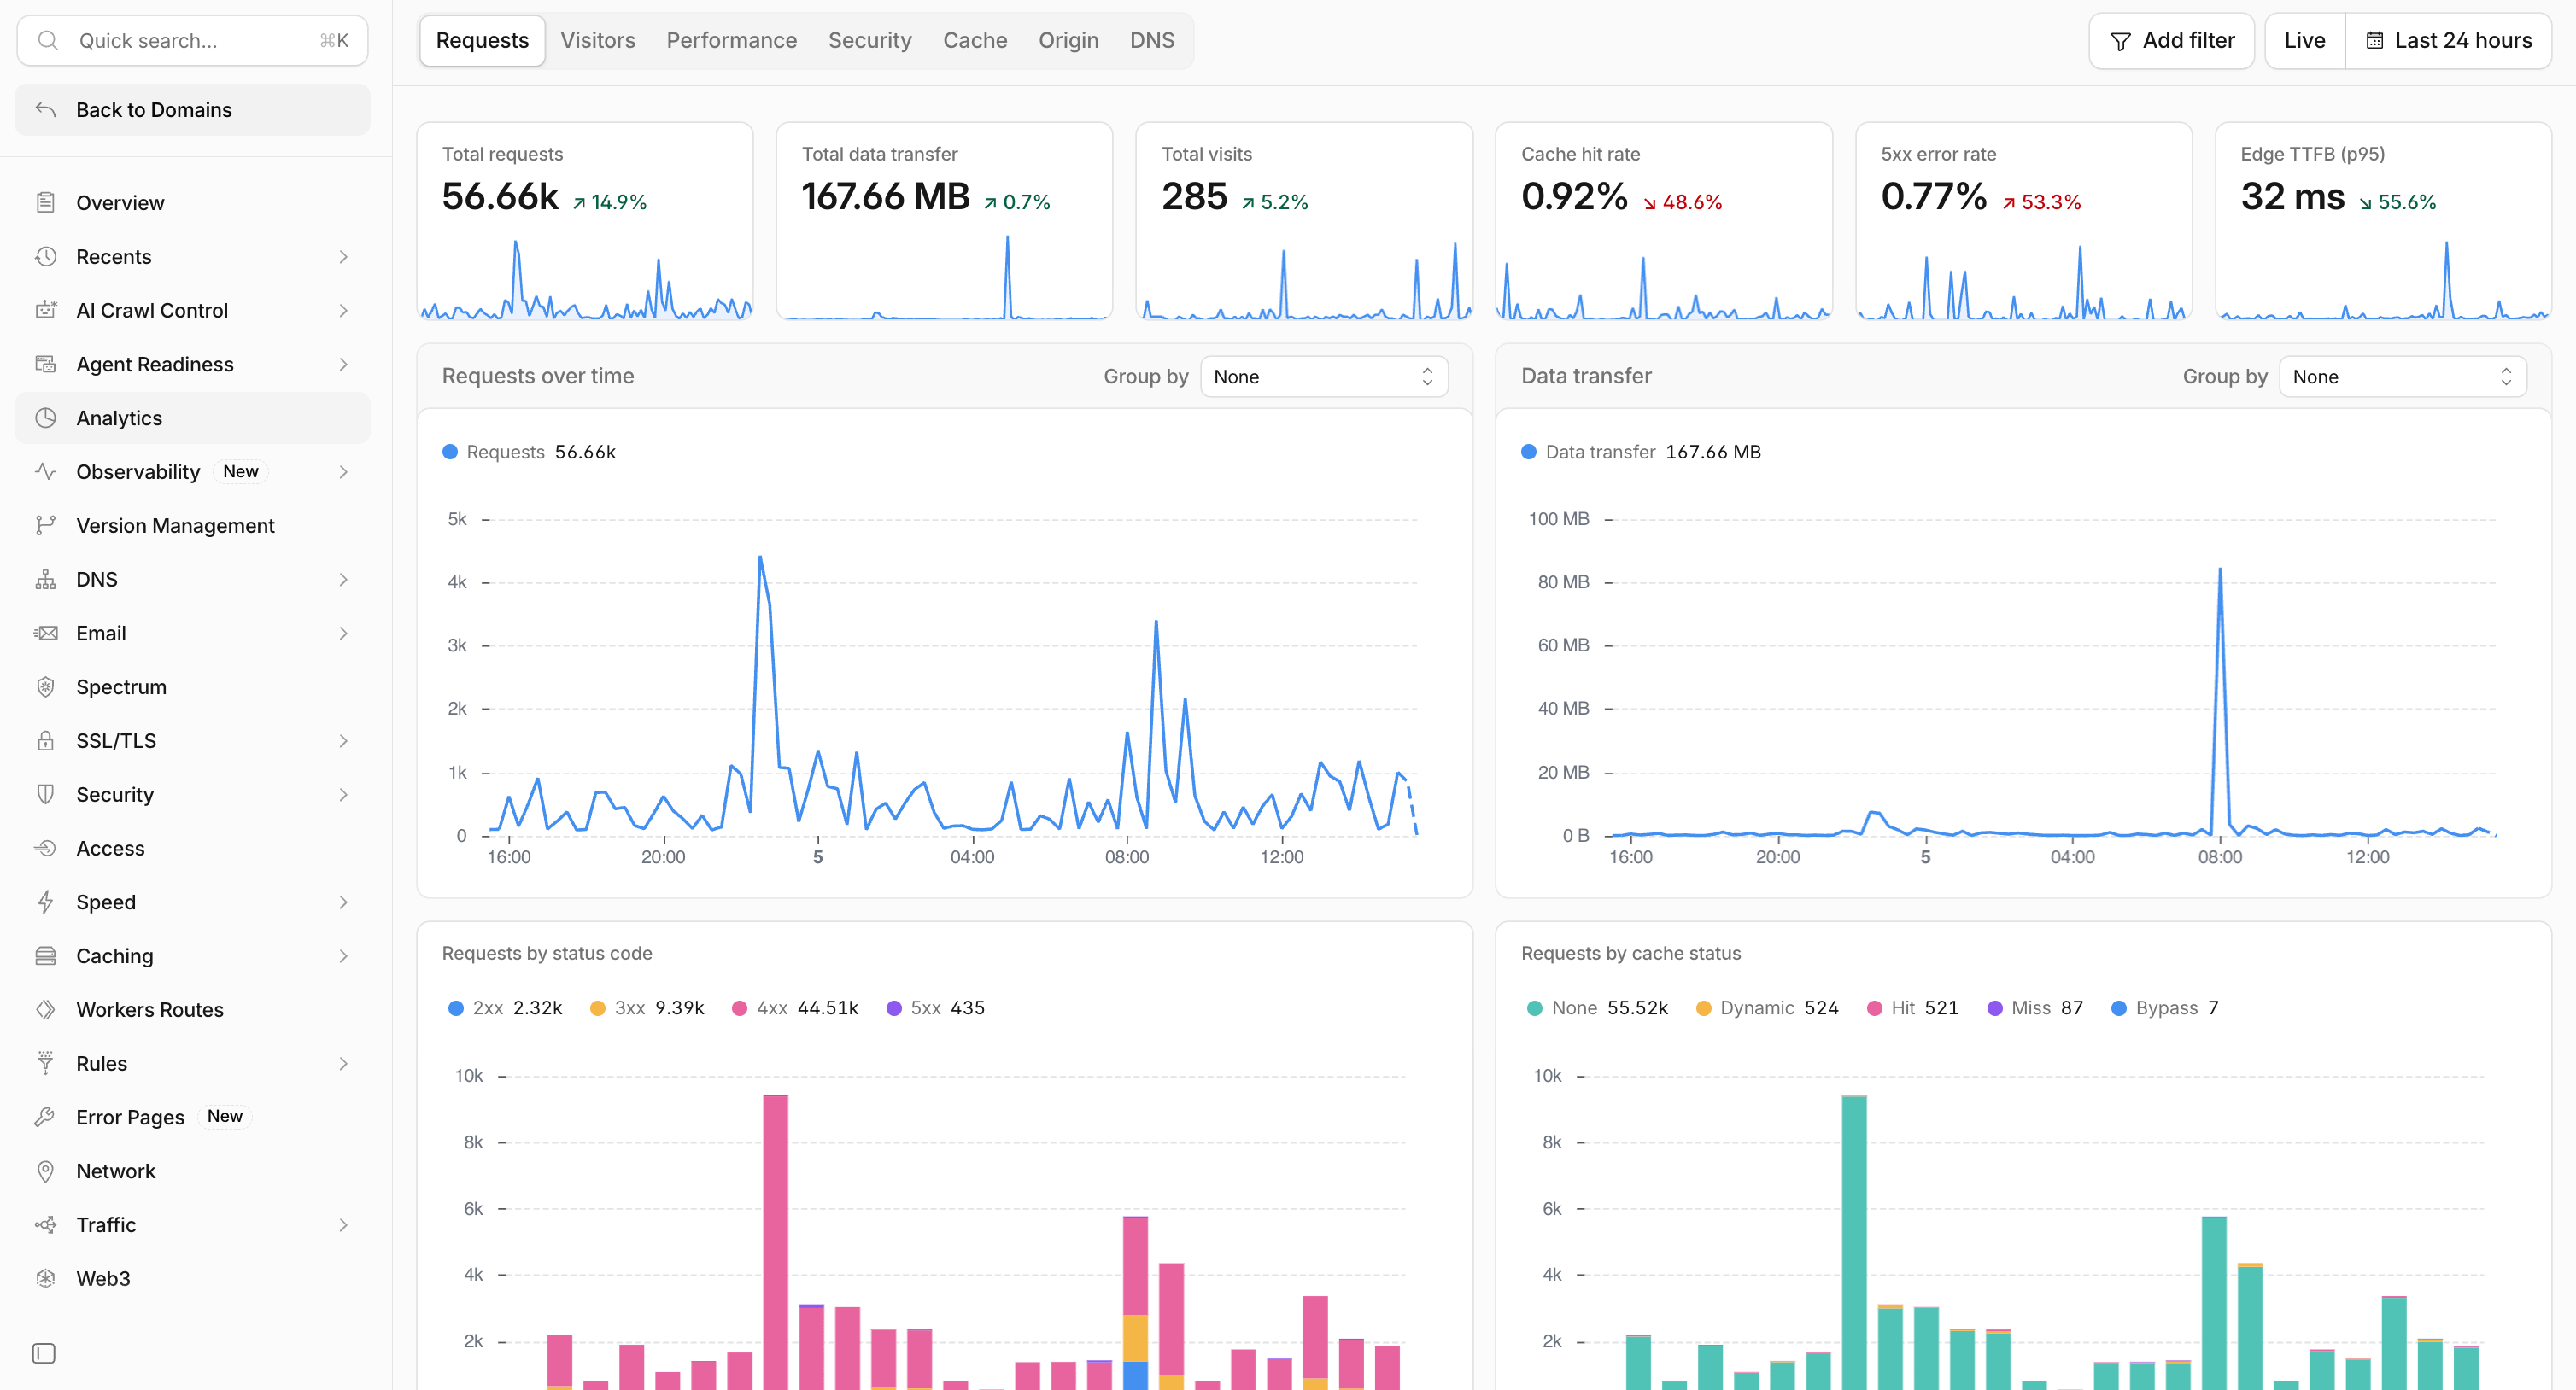 Cloudflare dashboard, domain Analytics > Requests tab (sampled).
For more exact numbers, query the unsampled http_requests dataset in Log Explorer:
SELECT
COUNT(*) AS total_requests,
SUM(EdgeResponseBytes) AS total_data_transfer_bytes,
SUM(EdgeResponseBytes) / (1024.0 * 1024.0 * 1024.0) AS total_data_transfer_gib,
SUM(EdgeResponseBytes) / (1024.0 * 1024.0) AS total_data_transfer_mib
FROM http_requests
WHERE clientrequestsource = 'eyeball'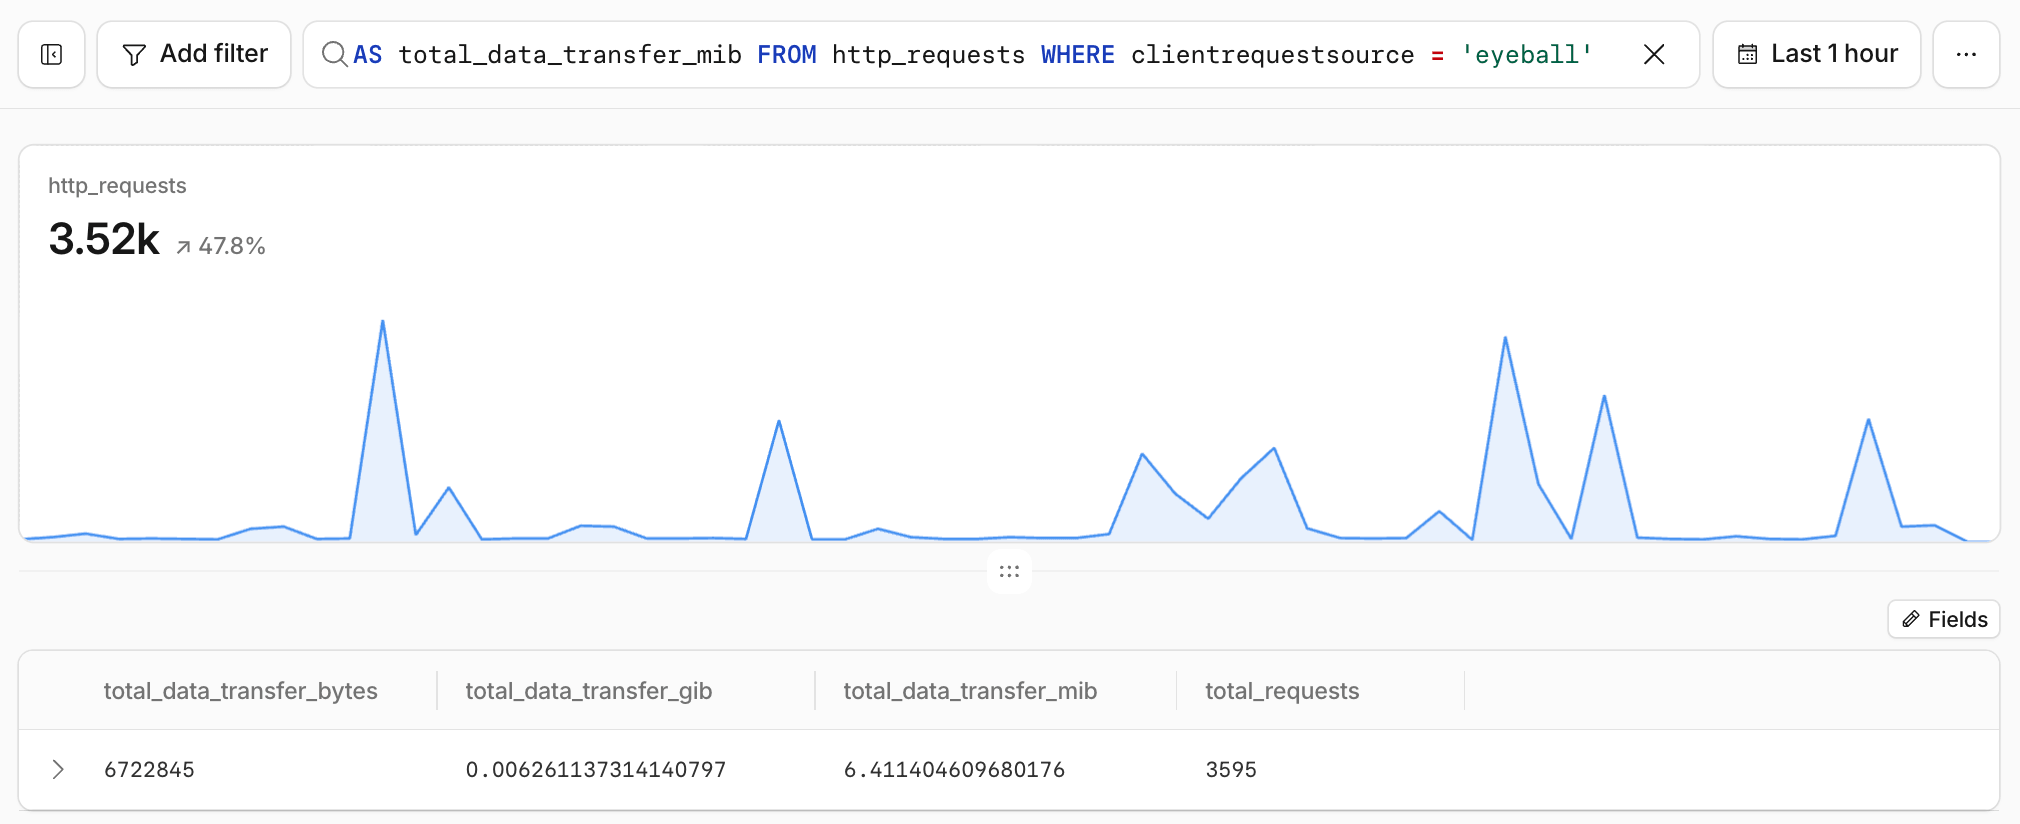 Cloudflare dashboard, Observability > Logs: CDN usage query on
 http_requests, end-user traffic only (unsampled).
Or run it through the Log Explorer API:
curl "https://api.cloudflare.com/client/v4/zones/{zone_id}/logs/explorer/query/sql" \
  --header "Authorization: Bearer <API_TOKEN>" \
  --url-query query="SELECT COUNT(*) AS total_requests, SUM(EdgeResponseBytes) AS total_bytes FROM http_requests WHERE date >= '2026-09-01' AND date <= '2026-09-30' AND ClientRequestSource = 'eyeball'"
Read the result correctly:
- Count end users only.
ClientRequestSourceseparateseyeballrequests from Cloudflare-generated ones such asedgeWorkerFetch,inBrowserChallenge,imageResizingorhealthcheck; the docs recommend filtering oneyeballto count end-user requests. - Bytes.
EdgeResponseBytesis what the edge returned to the client;EdgeResponseBodyBytesis the body alone. Dividing by 1024³ gives GiB; divide by 10⁹ for decimal GB. - Coverage. Log Explorer only holds events from the moment a dataset was enabled, and only the fields and filters chosen at ingestion. The default ingestion filter drops L7 DDoS events (
SecuritySourcescontainsl7ddos). - Time range. In Observability > Logs, the time picker scopes the query. Through the API, add a
date(YYYY-MM-DD) filter as in thecurlexample; without one, the query scans everything retained. A timestamp-only filter also works but is slower on large zones.
More Log Explorer Queries
Cloudflare’s example queries cover security actions, challenged IPs, bandwidth by URI, round-trip time by country, cache status and slow paths. Three worth keeping, slightly tightened:
Cache effectiveness for end users:
SELECT
CacheCacheStatus,
COUNT(*) AS requests,
SUM(EdgeResponseBytes) AS total_bytes,
AVG(EdgeTimeToFirstByteMs) AS avg_ttfb_ms
FROM http_requests
WHERE ClientRequestSource = 'eyeball'
GROUP BY CacheCacheStatus
ORDER BY requests DESC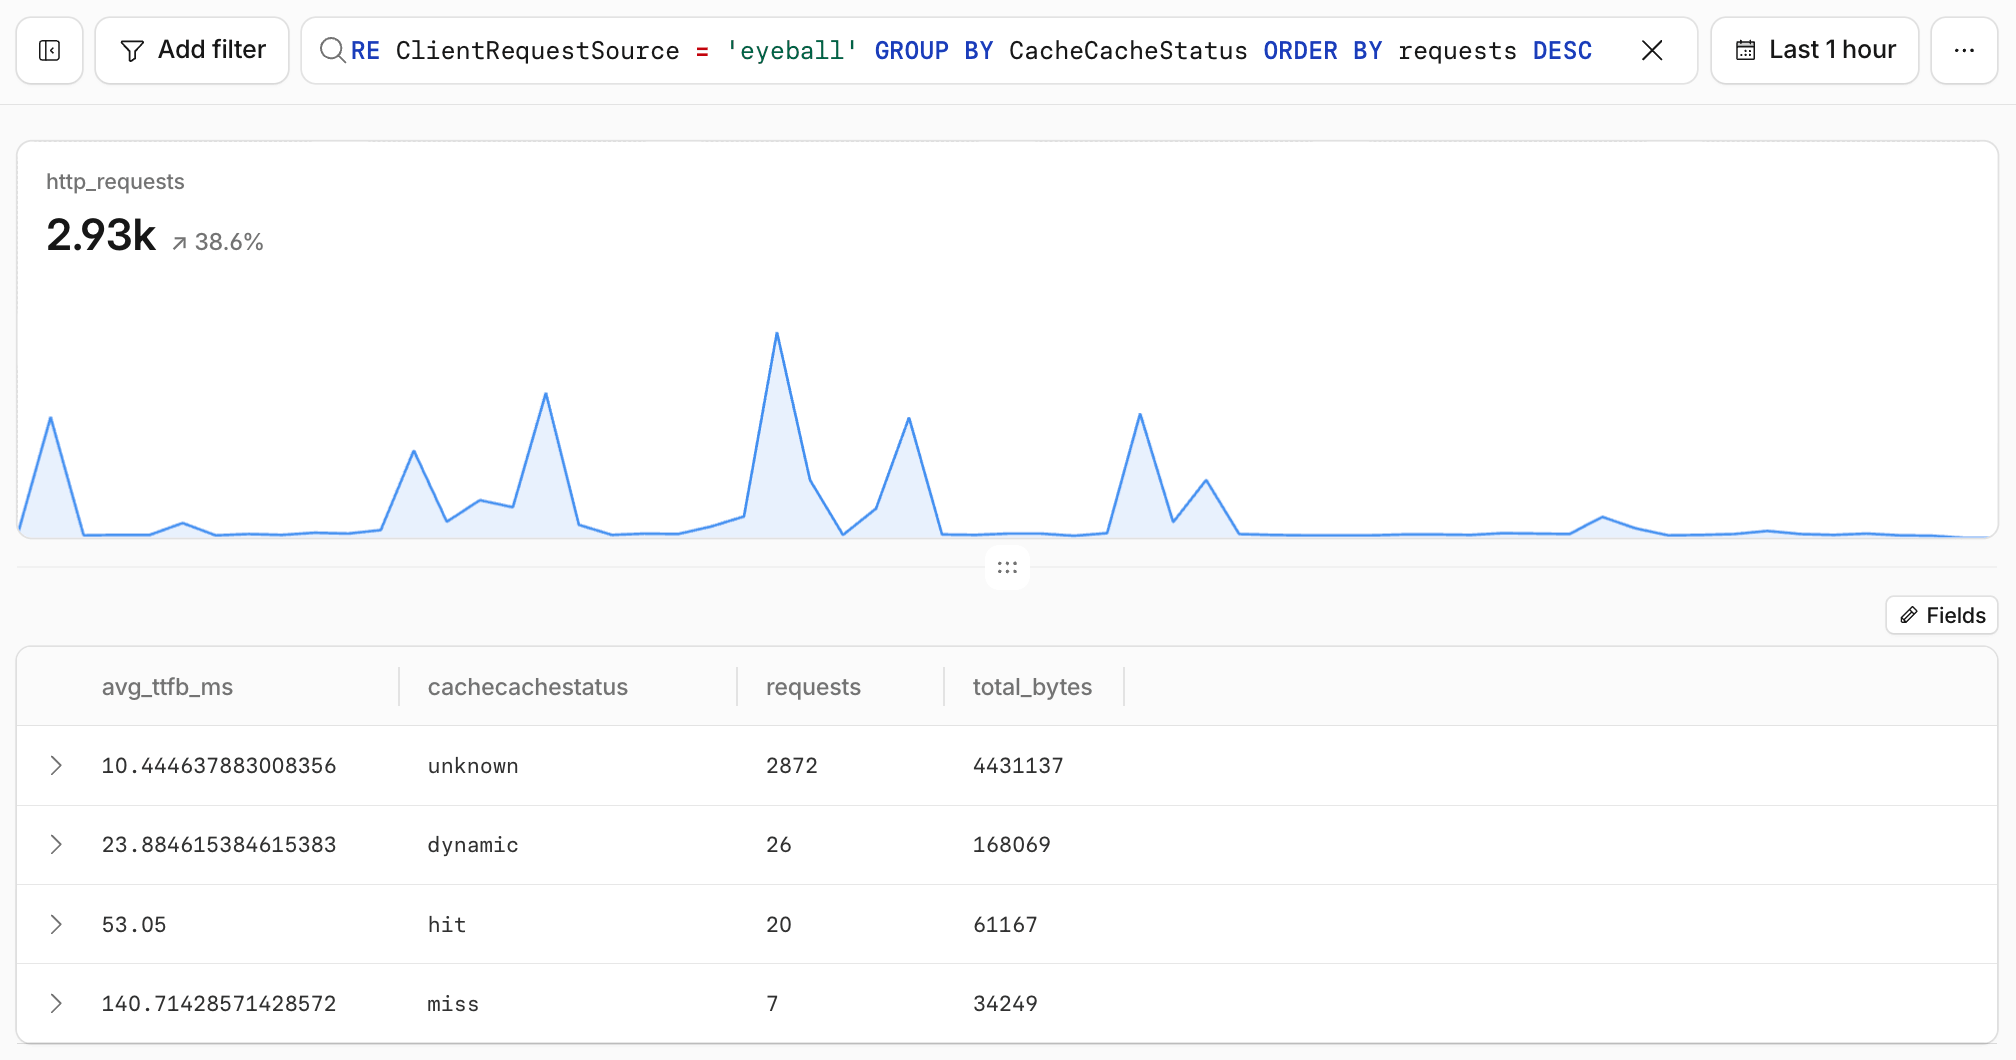 Cloudflare dashboard, Observability > Logs: requests, bytes and average TTFB per cache status.
Top URIs by data transfer. Divide by 1024.0, not 1024, or the result is truncated to whole MiB:
SELECT
ClientRequestURI,
COUNT(*) AS requests,
SUM(EdgeResponseBytes) / (1024.0 * 1024.0) AS mib_transferred
FROM http_requests
WHERE ClientRequestSource = 'eyeball'
GROUP BY ClientRequestURI
ORDER BY mib_transferred DESC
LIMIT 10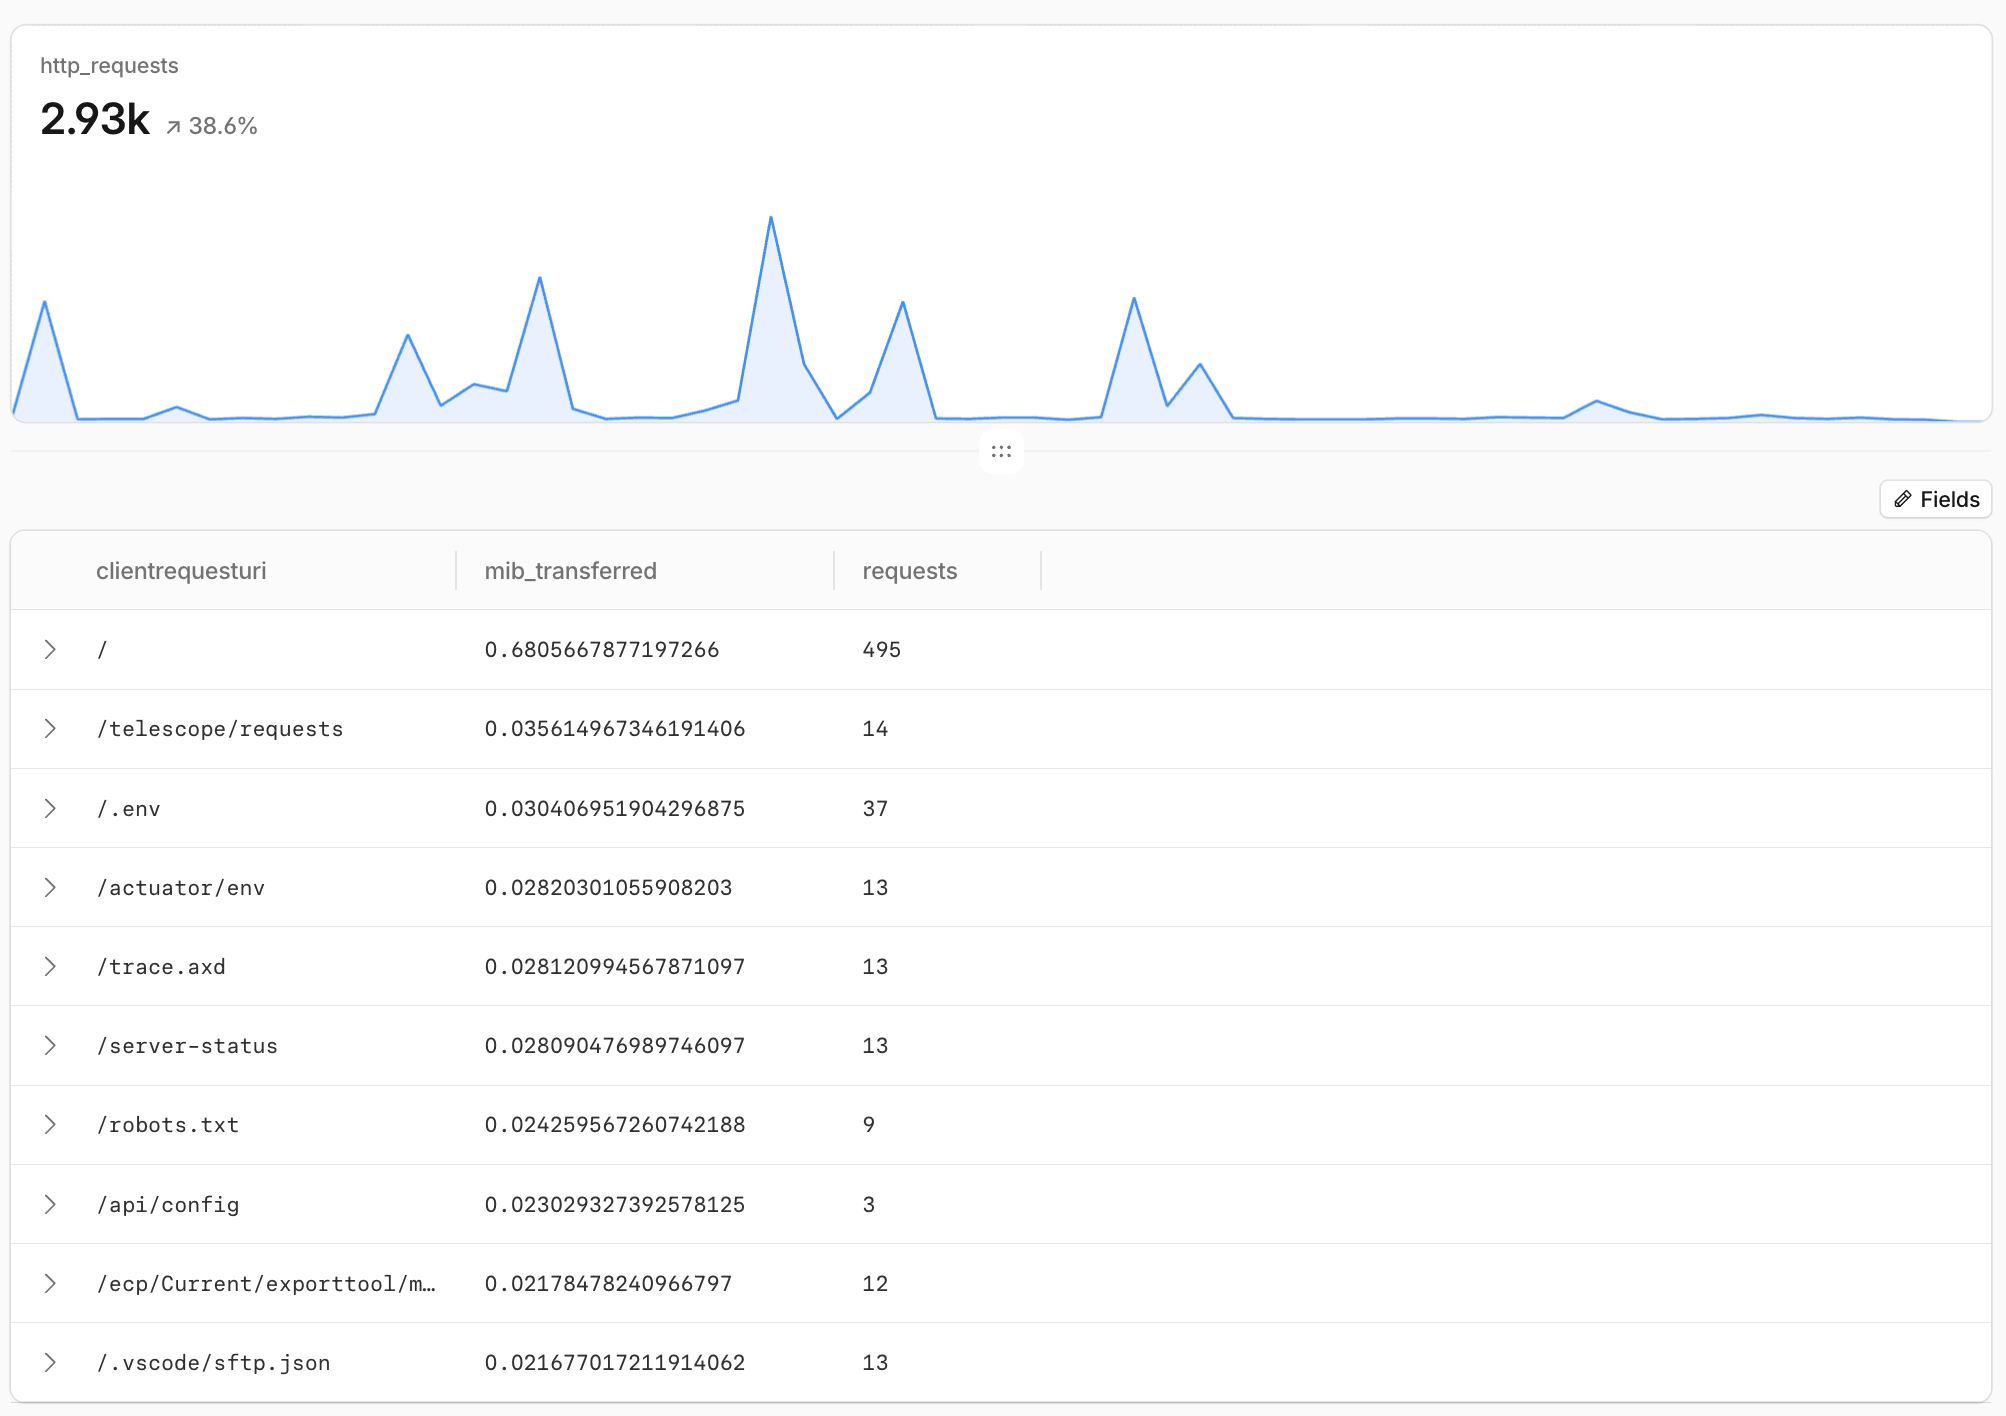 Cloudflare dashboard, Observability > Logs: top URIs by data transfer, in MiB.
Slowest paths. HAVING stops paths with one or two slow requests from topping the list:
SELECT
ClientRequestPath,
COUNT(*) AS requests,
AVG(EdgeTimeToFirstByteMs) AS avg_ttfb_ms,
SUM(CASE WHEN EdgeResponseStatus >= 500 THEN 1 ELSE 0 END) AS errors_5xx
FROM http_requests
WHERE ClientRequestSource = 'eyeball'
GROUP BY ClientRequestPath
HAVING COUNT(*) >= 100
ORDER BY avg_ttfb_ms DESC
LIMIT 10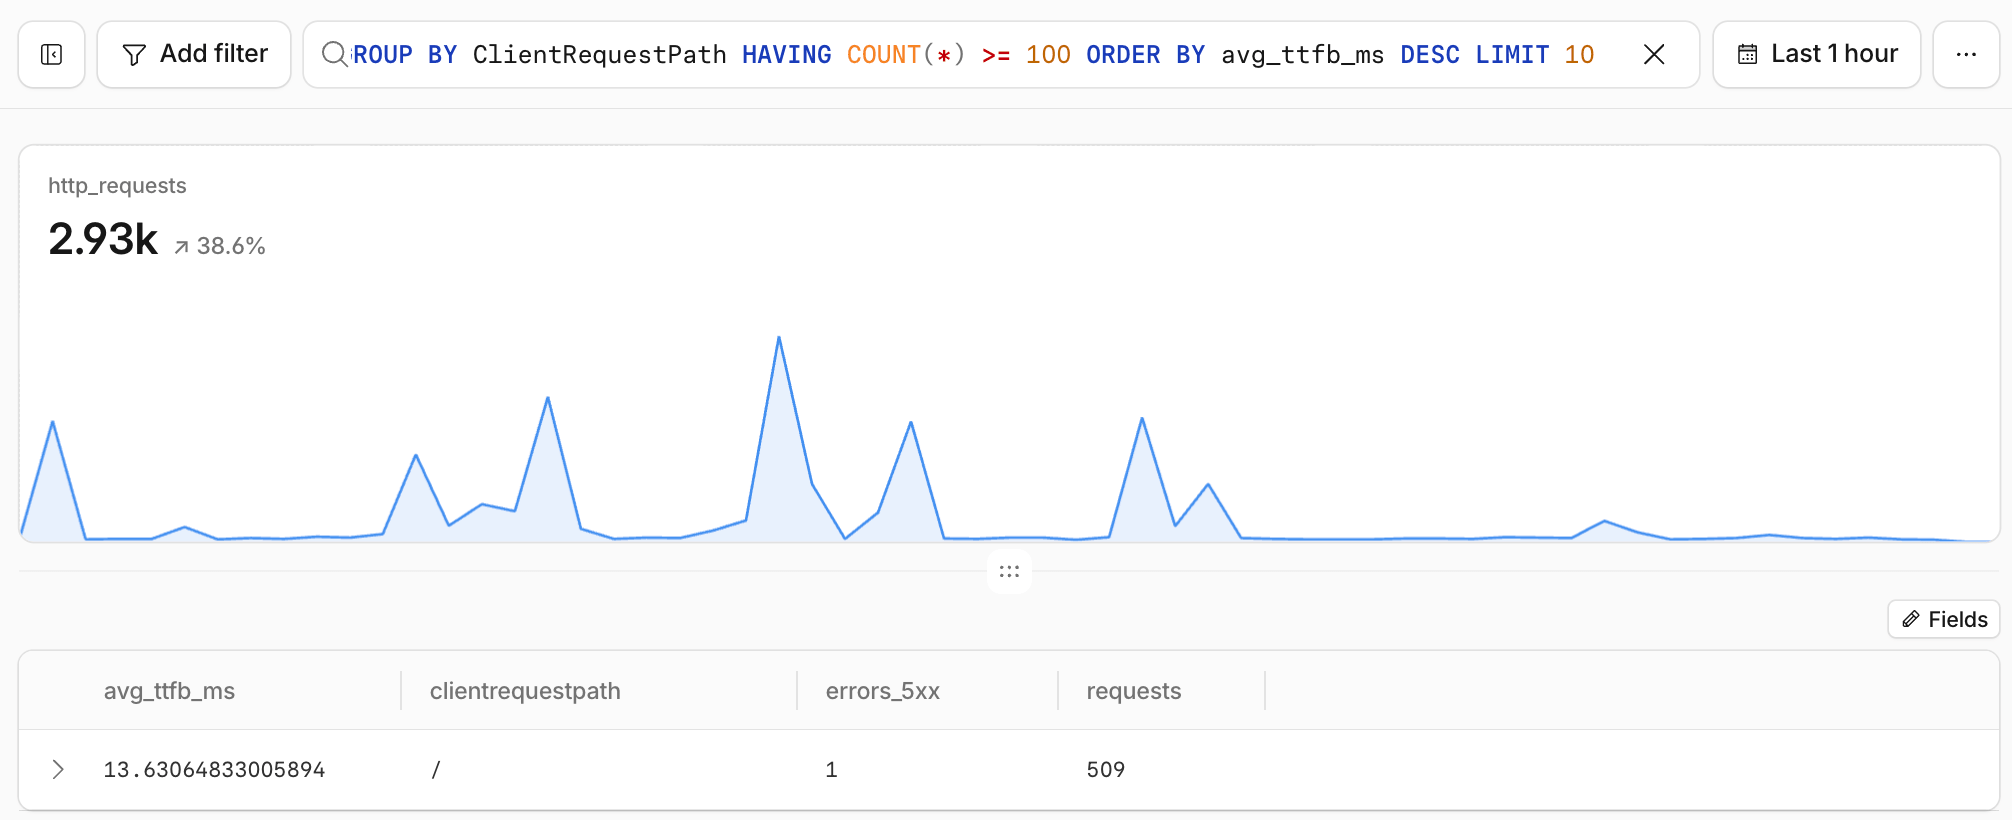 Cloudflare dashboard, Observability > Logs: slowest paths with at least 100 requests.
Query from Code: SQL API and GraphQL
Everything above also works from scripts, notebooks, Workers and agents. Two APIs cover most of it.
SQL API
The SQL API runs one SQL dialect over analytics (events.*, states.*) and logs (logs.*, including your Log Explorer datasets). Every query needs an account or zone scope, a lower time bound and exactly one dataset.
Look datasets up instead of guessing their names. The introspection endpoint lists what your account can query, with each dataset’s category and sampling; Log Explorer and Workers Analytics Engine datasets only appear where you have them. Add dataset_name and include_columns=true to get a dataset’s columns and types:
curl --get "https://api.cloudflare.com/client/v4/analytics/sql/introspection" \
  --header "Authorization: Bearer <API_TOKEN>" \
  --data-urlencode "account_tag=<ACCOUNT_TAG>" \
  --data-urlencode "dataset_name=events.httpRequests" \
  --data-urlencode "include_columns=true"
The cf CLI covers both steps: cf sql datasets --account-tag <ACCOUNT_TAG>, then cf sql query.
GraphQL Analytics API
The GraphQL Analytics API has a dynamic schema with more than 70 datasets. Explore it with introspection, most easily in the GraphQL API Explorer, or with a query such as this one, which lists the dimensions of account-level DNS analytics:
{
  __type(name: "AccountDnsAnalyticsAdaptiveGroupsDimensions") {
    fields { name description }
  }
}
The settings node shows how far back, and over how long a window, each dataset can be queried for your plan.
Datasets with Adaptive in their name are sampled, and their count and sum fields are already estimates. Add confidence(level: 0.95) to get the range the true value most likely falls in:
httpRequestsAdaptiveGroups(filter: $filter, limit: 1) {
  count
  confidence(level: 0.95) {
    count { estimate lower upper sampleSize }
  }
}
Account-Wide Weekly Totals
One GraphQL request returns end-user CDN traffic trends per zone, total account-level DNS queries across all zones, and Workers requests and CPU time:
query AccountWeeklyUsage(
  $accountTag: string!
  $start: Time!
  $end: Time!
  $startDate: Date!
  $endDate: Date!
) {
  viewer {
    accounts(filter: { accountTag: $accountTag }) {
      cdnByZone: httpRequestsAdaptiveGroups(
        filter: { datetime_geq: $start, datetime_lt: $end, requestSource: "eyeball" }
        limit: 10
        orderBy: [sum_edgeResponseBytes_DESC]
      ) {
        count
        sum { edgeResponseBytes }
        dimensions { zoneTag }
      }
      dnsQueries: dnsAnalyticsAdaptiveGroups(
        filter: { date_geq: $startDate, date_leq: $endDate }
        limit: 1
      ) {
        count
      }
      workers: workersInvocationsAdaptive(
        filter: { datetime_geq: $start, datetime_lt: $end }
        limit: 1
      ) {
        sum { requests cpuTimeUs }
      }
    }
  }
}
{
"accountTag": "<ACCOUNT_ID>",
"start": "2026-09-28T00:00:00Z",
"end": "2026-10-05T00:00:00Z",
"startDate": "2026-09-28",
"endDate": "2026-10-04"
}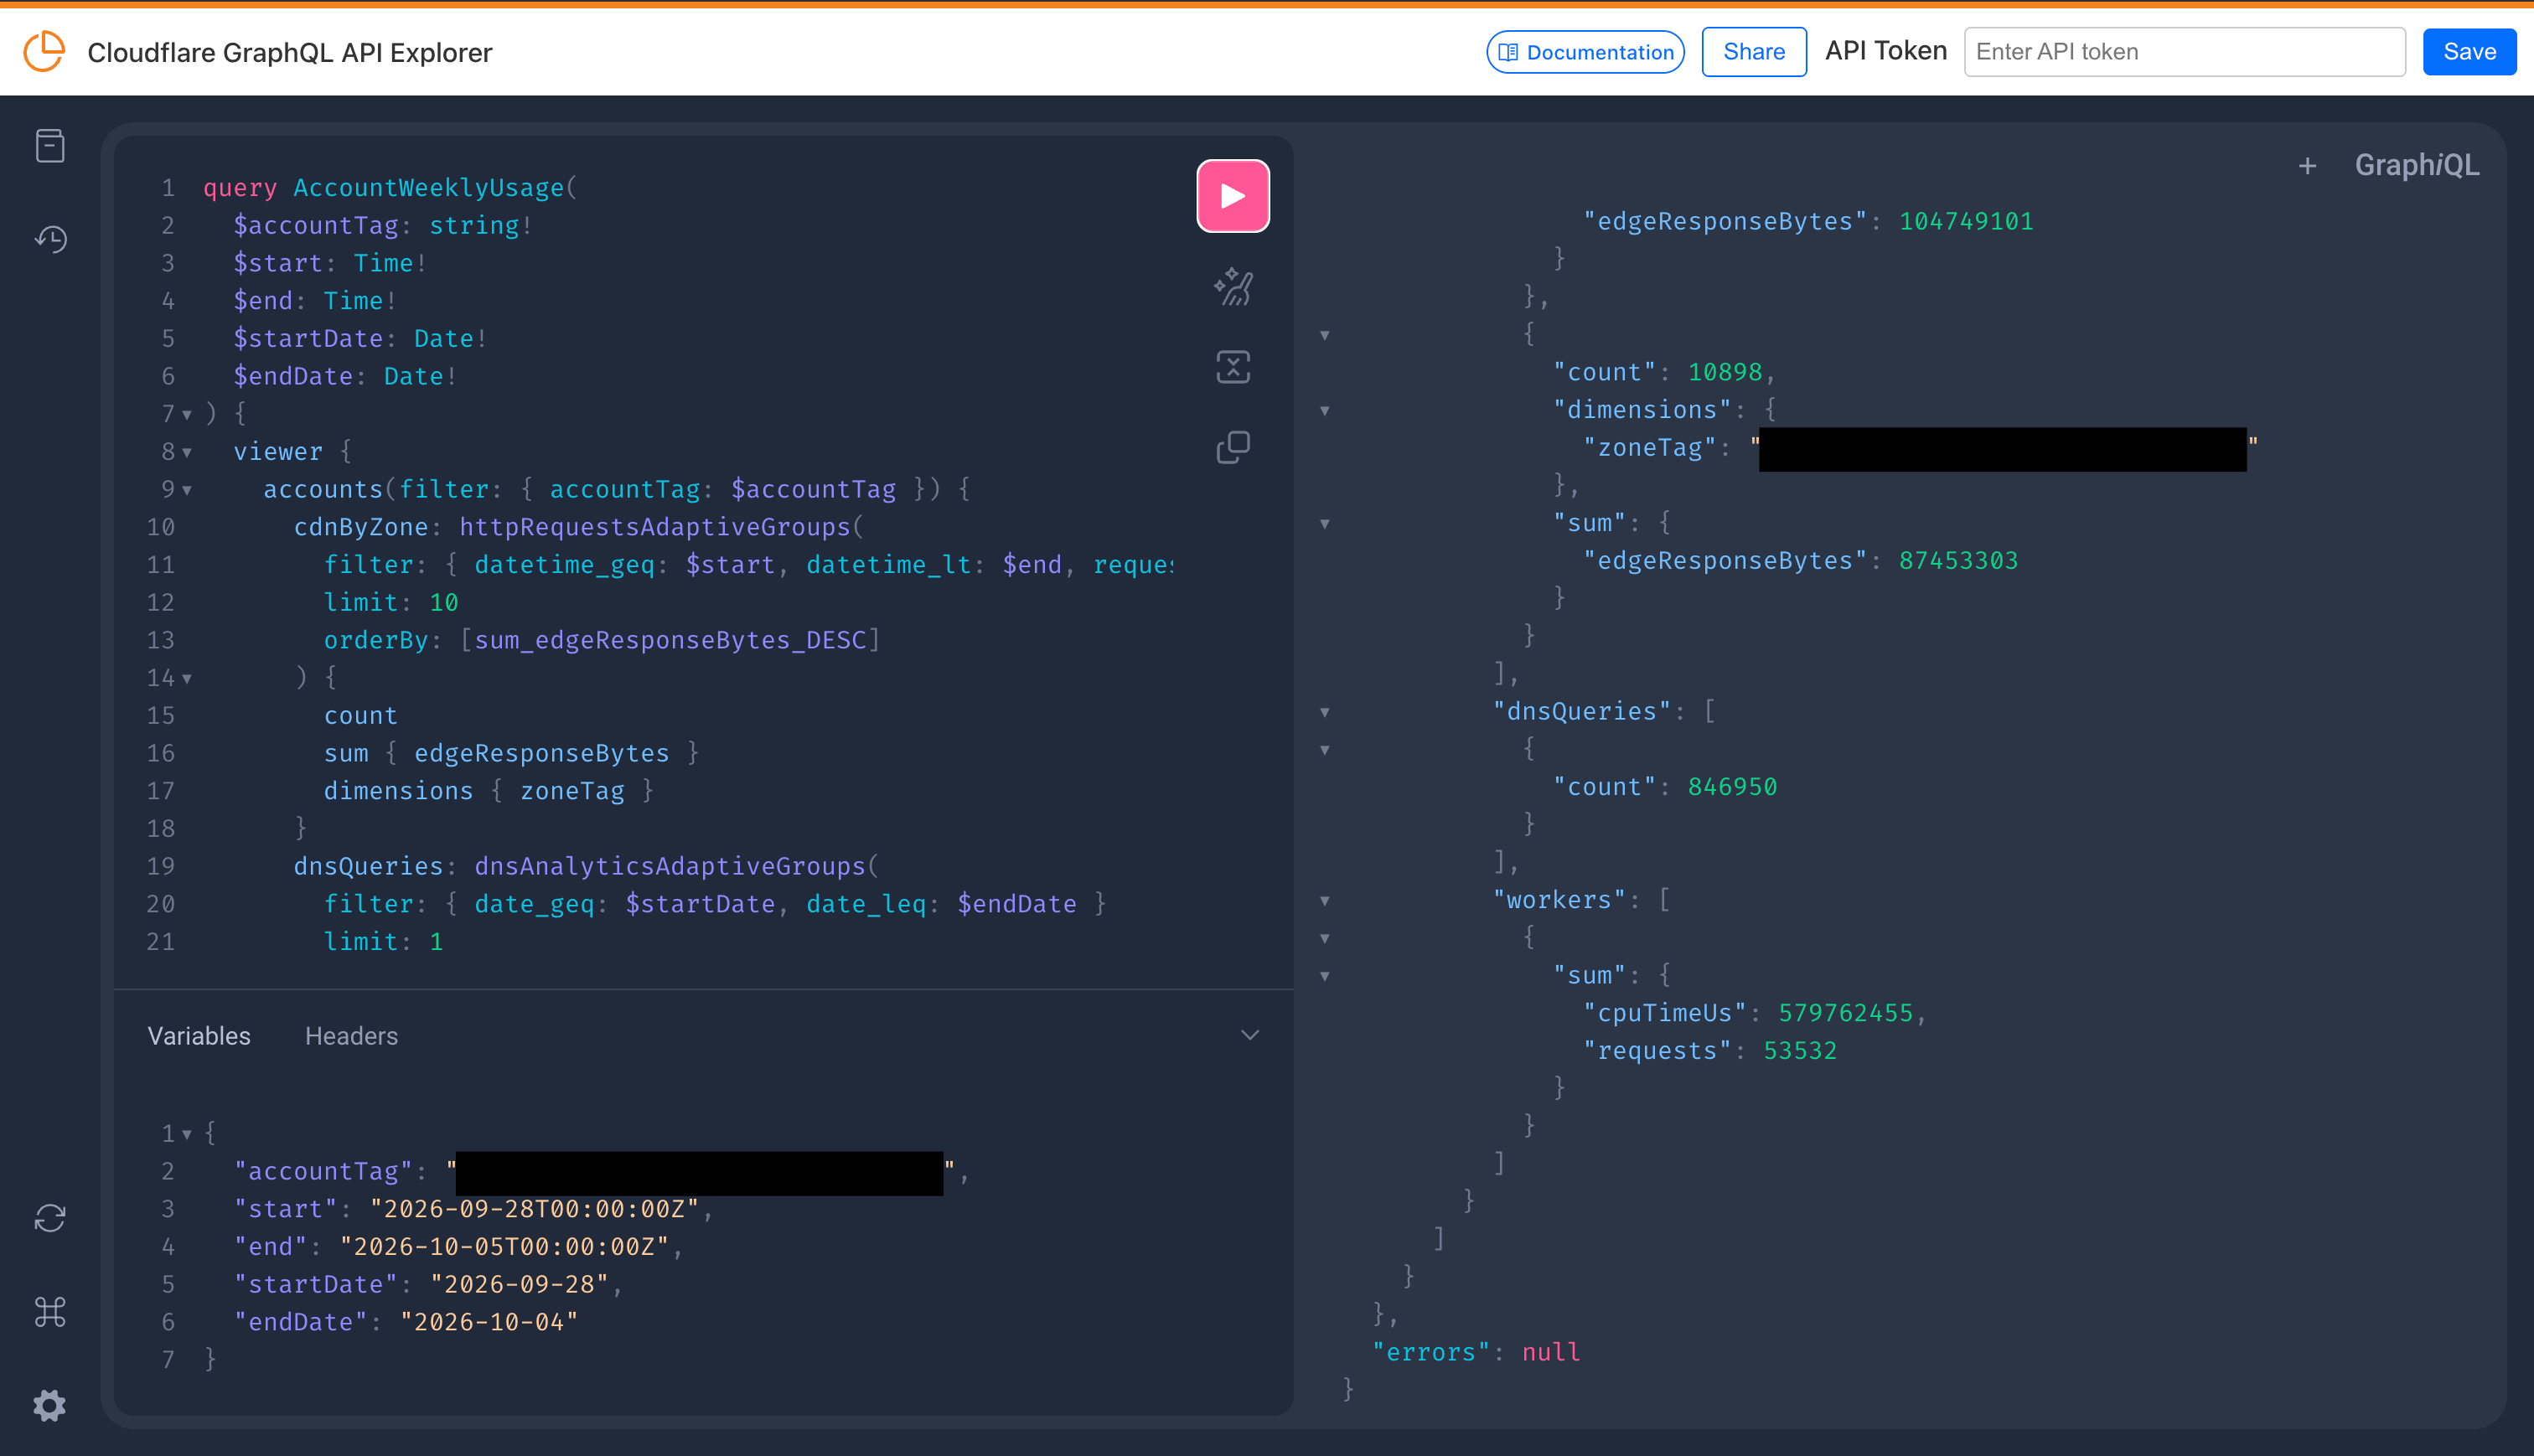 Cloudflare GraphQL API Explorer: the account-wide weekly totals query and its result; account and zone IDs redacted.
To compare several weeks in one request, repeat a field under a different alias, such as week_2026_09_28: dnsAnalyticsAdaptiveGroups(...) and week_2026_09_21: dnsAnalyticsAdaptiveGroups(...). To split a week by day or by zone, group by the date or zoneTag dimension. cpuTimeUs is in microseconds; divide by 1,000 to compare it with CPU milliseconds.
Rate Limits
All of these run on the Cloudflare API, so the standard API rate limits apply: 1,200 requests per five minutes per user, counted across the dashboard, API keys and API tokens. Above that, API calls return HTTP 429 for the next five minutes. On top of that:
- GraphQL limits: 300 queries per five minutes per user by default (cost-based, so heavy queries use the budget faster; the error reads
Rate limiter budget depleted), up to 10 zones or 1 account per query, and per-dataset limits on time range, fields and rows. Account-based rate limiting helps when you query many zones or accounts. - SQL API limits: one statement per request,
ORDER BYneedsLIMIT, and HTTP429,503or507when a query exceeds rate or resource limits. HonorRetry-After.
Agents and notebooks hit these limits quickly: combine questions into one GraphQL request with aliases, narrow time ranges, and back off on 429. Enterprise customers can ask Cloudflare Support to raise the API and GraphQL limits.
Usage vs. Billed Usage
Analytics and logs measure traffic. Billing applies each product’s own definition of a billable unit, and automatically excludes DDoS attack traffic, so an invoice can differ from what you count yourself. The invoice is authoritative.
| NEED | WHERE | AVAILABLE TO |
|---|---|---|
| Daily usage-based cost that matches the invoice | Billable Usage dashboard, or the Billable Usage API (GET /accounts/{account_id}/billable-usage, Billing Read token) | Pay-as-you-go accounts |
| An alert when total spend crosses a dollar amount | Budget alerts | Pay-as-you-go accounts |
| An alert when one product’s usage crosses a threshold | Notifications > Usage Based Billing (usage-based billing notifications) | Pay-as-you-go accounts |
| An alert on your own usage query | Custom Alerts (beta), for example on daily eyeball data transfer | All plans |
| Which products are metered, and how | Usage-based billing | All |
The Billable Usage dashboard, API and budget alerts do not support Enterprise contracts yet. Cloudflare has said an equivalent experience for Enterprise contracts is in the works, so Enterprise customers can expect similar functionality in the future.
What does not cost extra:
- DDoS attack traffic. DDoS protection has been free, unmetered and unlimited since 2017, and Cloudflare’s billing systems exclude attack traffic from your usage. Cloudflare’s Enterprise packages put it as no “attack traffic tax”: you pay for clean traffic, not the malicious requests Cloudflare blocks.
- The
/cdn-cgi/endpoint. Word on the street (not officially documented) is that requests to the Cloudflare-managed/cdn-cgi/endpoint, such as challenges or Web Analytics beacons, are usually excluded from billing. The exception is Images: transformations under/cdn-cgi/image/are billable. Confirm with your account team, and measure the share by addingAND ClientRequestPath LIKE '/cdn-cgi/%'to the CDN usage query. - Waiting in Workers. Workers are billed for CPU time, not duration: there is no charge for wall-clock time, so a Worker waiting on a database, an API or an LLM response costs nothing while it waits. Subrequests a Worker makes and requests to static assets are not billed either.
- Idle Durable Objects. Durable Objects are billed differently from Workers: for duration, the wall-clock time an object is active (charged at 128 MB per object), including time it spends waiting on I/O. Duration stops as soon as an object is idle and eligible to hibernate, even before it is evicted from memory. The WebSocket Hibernation API is what makes an object with open WebSocket connections eligible between messages, so idle connections cost no duration. A WebSocket accepted with the standard
accept()keeps duration running for as long as it stays connected. Alarms are the catch: every alarm invocation wakes the object and is billed as a request plus duration, and everysetAlarm()as a row written. Analarm()handler that always reschedules itself, or a constructor that callssetAlarm()without first checkinggetAlarm(), can keep objects awake indefinitely, multiplied across every object of that class. Give recurring alarms an exit condition, a sensible minimum interval and backoff on errors, check AI-generated Durable Object code for this before deploying, and watchdurableObjectsInvocationsAdaptiveGroupsgrouped bytypefor unexpected growth. - Egress from partner clouds. With Cloudflare as the security umbrella and connectivity cloud in front of your cloud providers, members of the Bandwidth Alliance, such as Oracle Cloud and Alibaba Cloud, discount or waive their data transfer fees for traffic to Cloudflare. Microsoft Azure customers can lower egress to Cloudflare with Routing Preference. Check the partner list for your provider.
Correlate One Request Across Datasets
The Ray ID is the join key in the most common cases. It is returned in the cf-ray response header and shown on Cloudflare error pages.
| WHERE | HOW |
|---|---|
| HTTP requests | RayID; ParentRayID links a Worker subrequest to its parent |
| Firewall events | RayID |
| Account Abuse Protection Events | RayID |
| Websocket Analytics | RayID |
| Access requests | RayID |
| Cloudflare Traces | Filter on the Ray ID to open the full span tree: rules, cache, Workers, origin |
| Log Explorer | Filter on RayID |
SELECT
EdgeStartTimestamp,
RayID,
ClientRequestHost,
ClientRequestPath,
EdgeResponseStatus,
SecurityAction,
CacheCacheStatus,
WorkerScriptName,
OriginResponseStatus
FROM http_requests
WHERE RayID = '<RAY_ID>'
LIMIT 1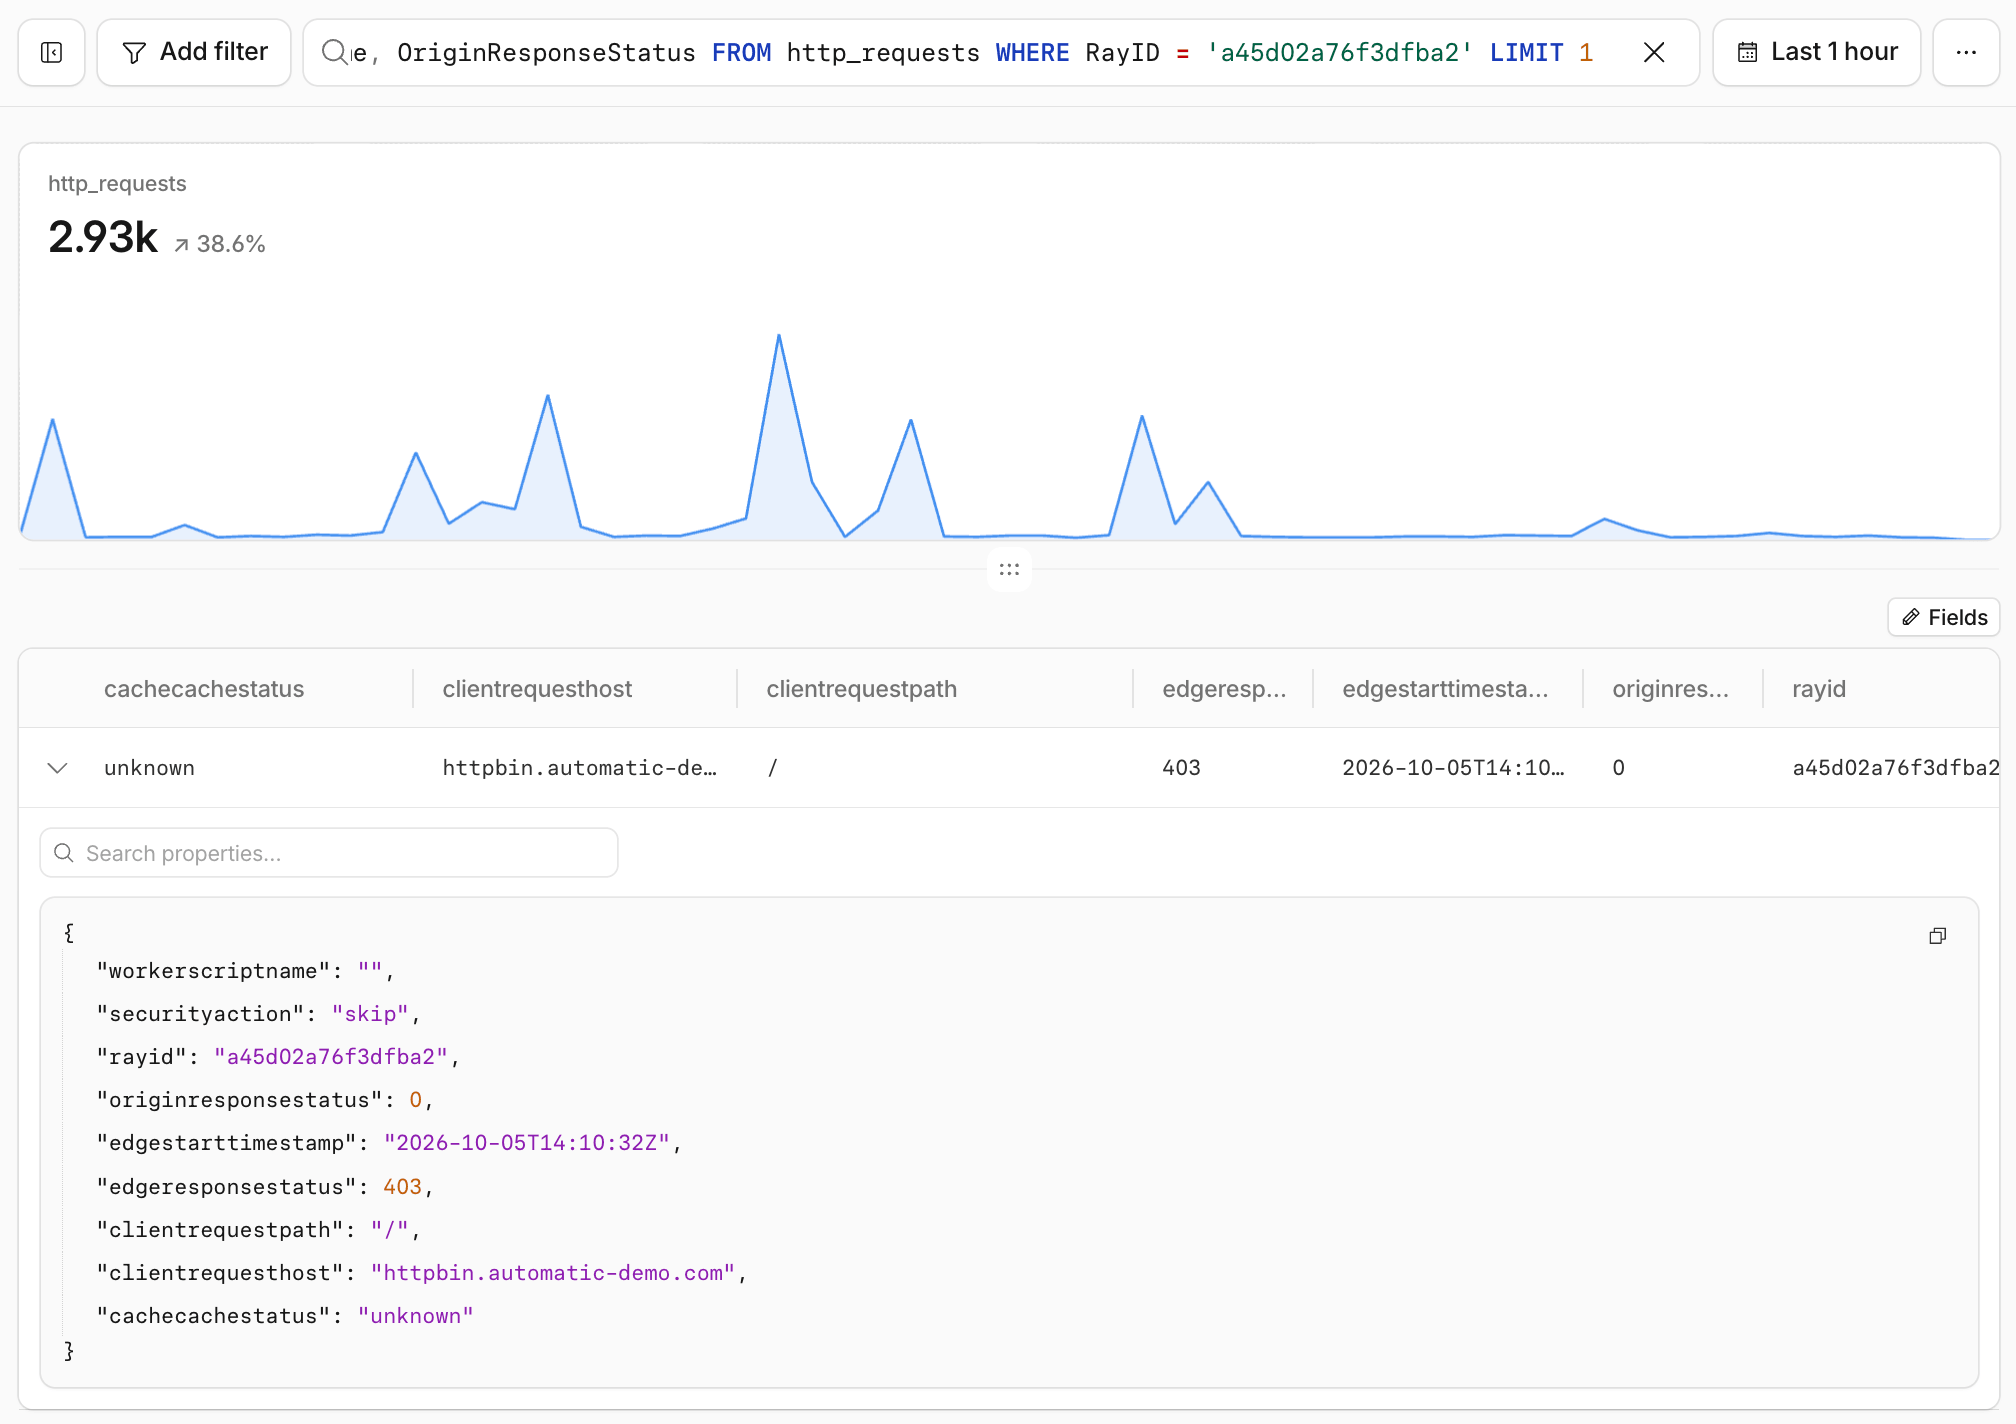 Cloudflare dashboard, Observability > Logs: one request in
 http_requests, looked up by Ray ID.
Then pivot with the same Ray ID. firewall_events lists every security rule that acted on the request and what it did: here, two skip rules; for a blocked request, the rule that blocked it.
SELECT RayID, Action, Source, RuleID, Description
FROM firewall_events
WHERE RayID = '<RAY_ID>'
LIMIT 5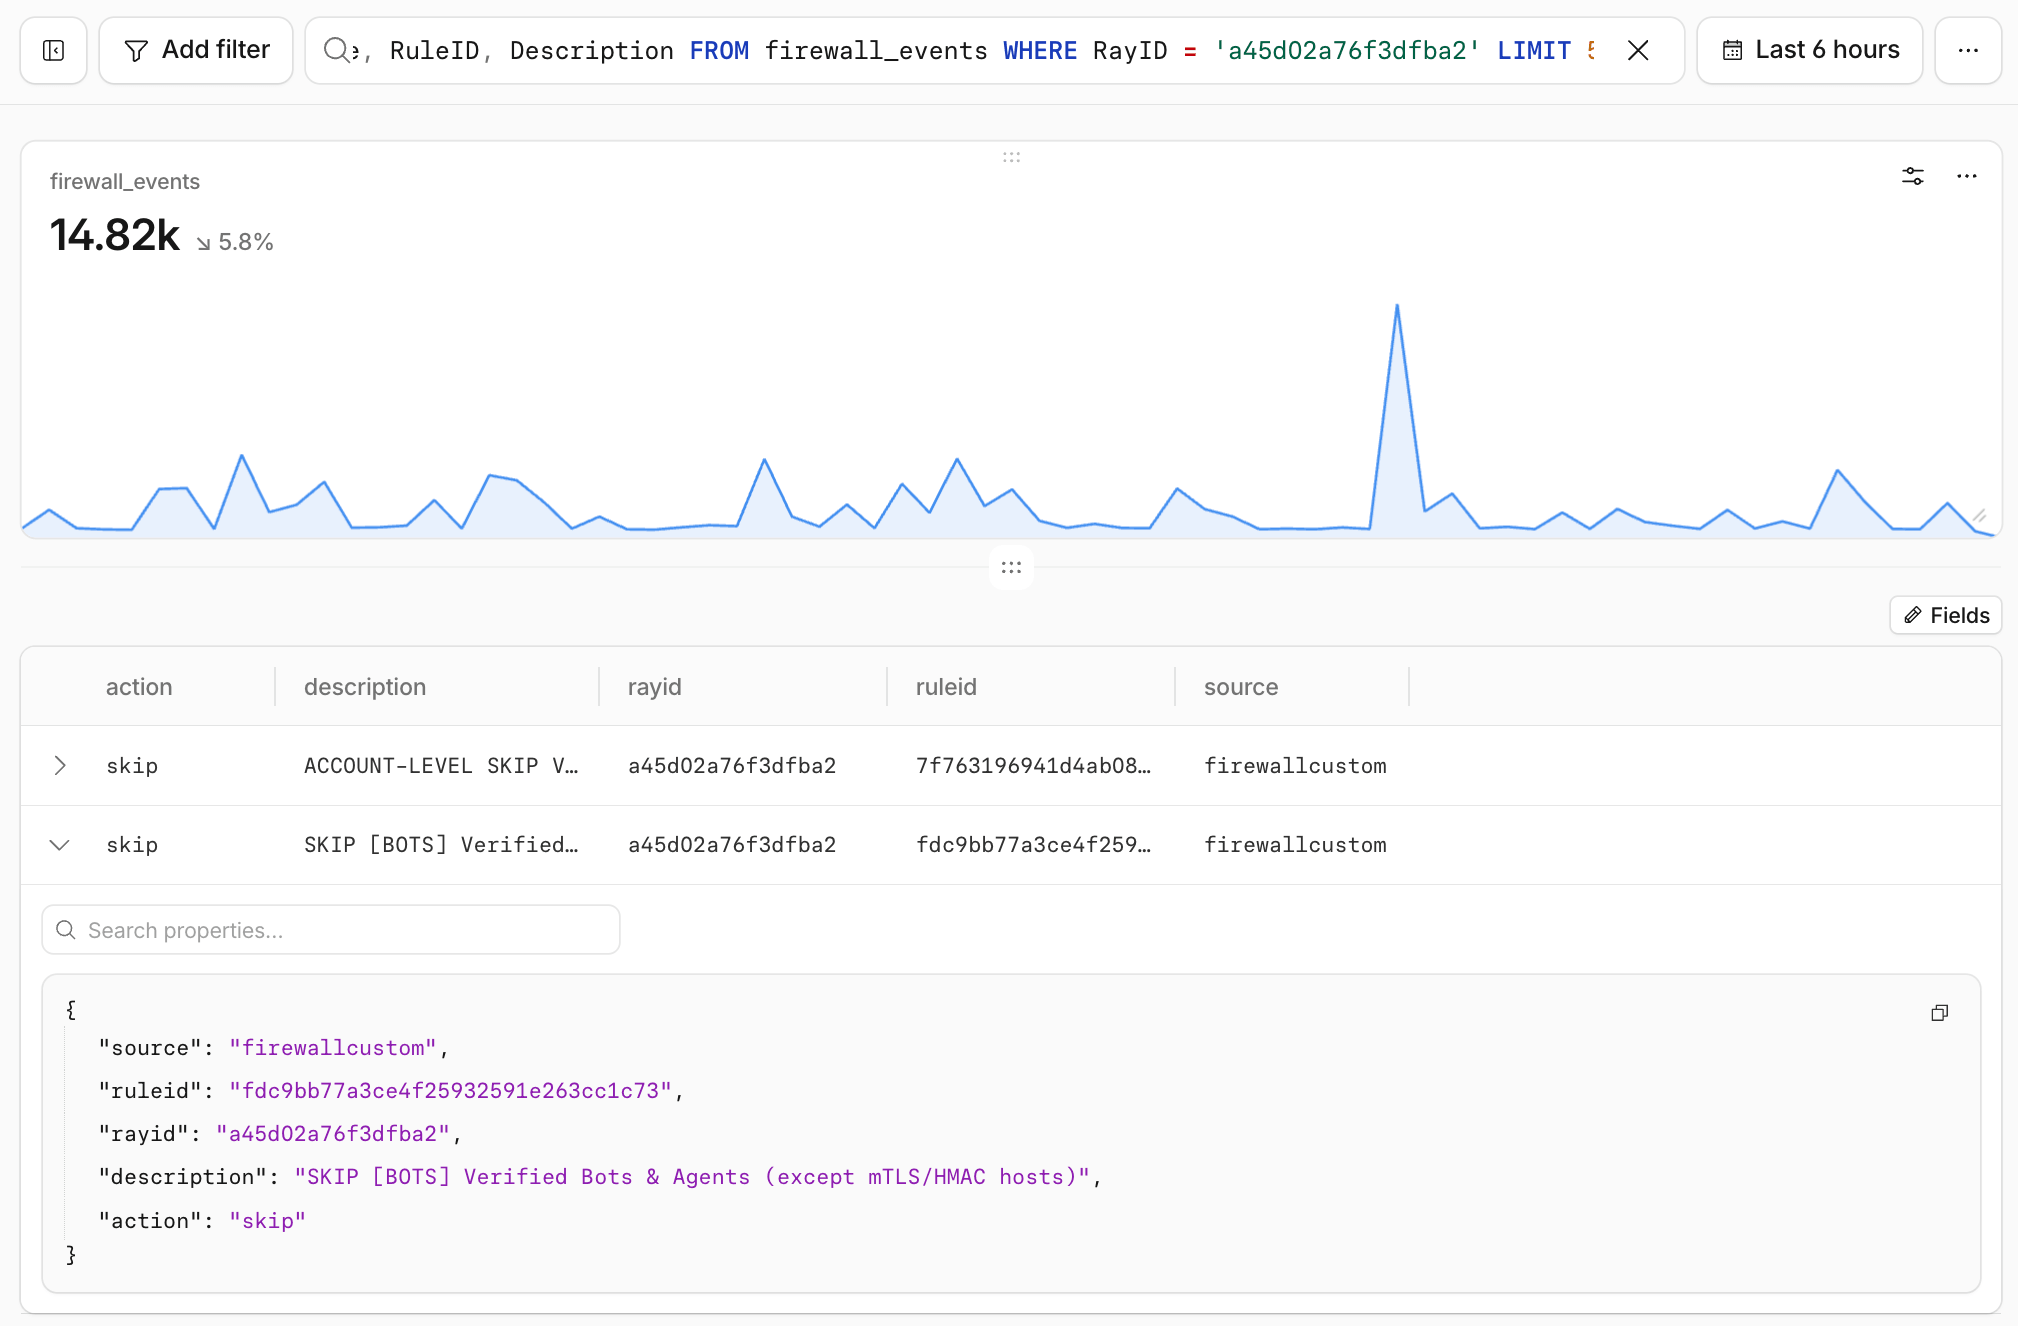 Cloudflare dashboard, Observability > Logs: the same Ray ID in
 firewall_events, with the rules that acted on it.
Gateway HTTP and Your Zone
The gateway_http dataset has no RayID field. Its identifiers are RequestID, SessionID, DeviceID, UserID and Email. When a user behind Gateway opens a hostname on your own zone, you get two independent records: Gateway’s, and your zone’s http_requests, where ClientIP is a Gateway egress IP.
Time window, hostname, path and status code are usually enough for an investigation. It is not one-to-one, though. To join the records deterministically, stamp the request:
- Create a Gateway HTTP policy with the Allow action, scoped to your own domains, that sets request headers from dynamic values. Requires TLS decryption. Gateway applies the first matching Allow or Block policy, so place it after your security Block policies and before any broader Allow policy that already matches those hostnames.
- Log the headers on each zone with custom fields: add
x-gateway-deviceandx-gateway-useras request headers. - Query both datasets by the same value.
In the dashboard, create the policy under Zero Trust > Traffic controls > Firewall policies > HTTP, with Modify request headers set to Overwrite. With the Gateway rules API (POST /accounts/{account_id}/gateway/rules), the request body is:
{
  "name": "ALLOW Stamp Gateway IDs for Own Zones",
  "action": "allow",
  "enabled": true,
  "filters": ["http"],
  "traffic": "any(http.request.domains[*] in {\"example.com\" \"example.net\"})",
  "rule_settings": {
    "set_headers": {
      "X-Gateway-Device": ["@{device.id}"],
      "X-Gateway-User": ["@{identity.id}"]
    }
  }
}
http.request.domains matches each domain and all its subdomains. set_headers overwrites any value the client sends on Gateway traffic, but a request that bypasses Gateway can still carry the header: treat it as a correlation key, not as proof of identity.
SELECT Datetime, Email, DeviceID, URL, HTTPStatusCode, Action, RequestID
FROM gateway_http
WHERE DeviceID = '<DEVICE_ID>' AND Action != 'bypass'
LIMIT 100
Action != 'bypass' drops Do Not Inspect traffic, which Gateway logs without a URL or request ID and cannot stamp with headers.
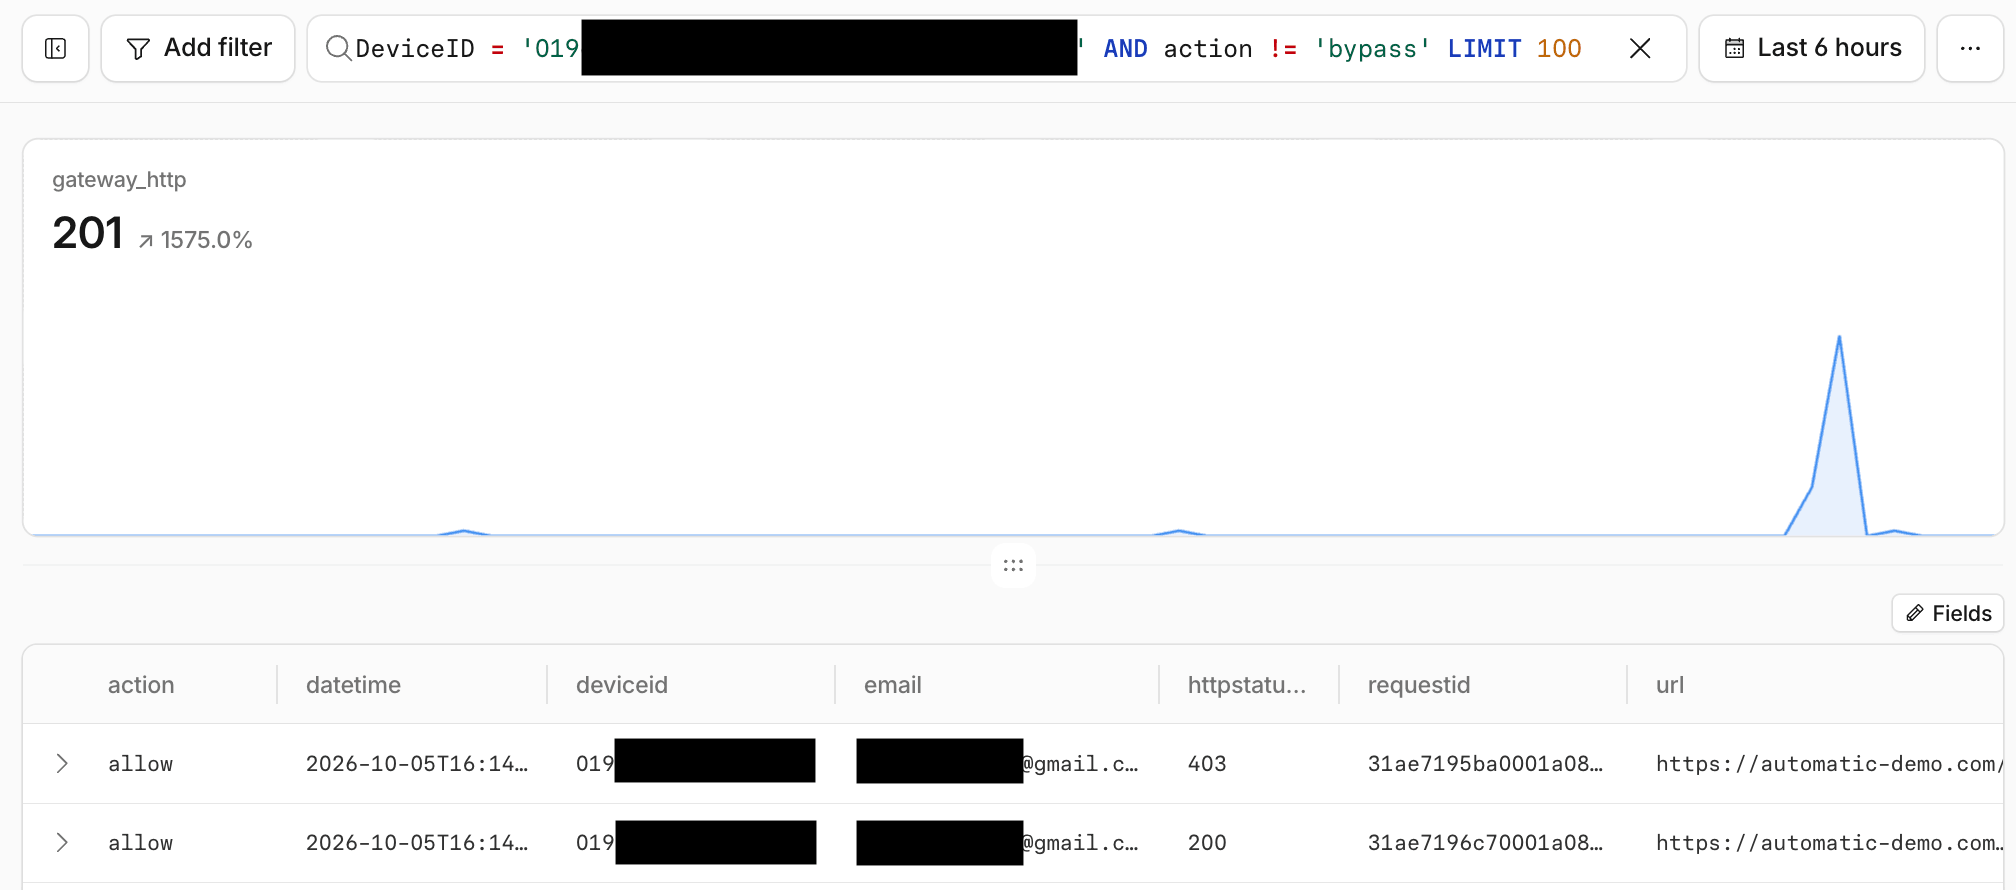 Cloudflare dashboard, Observability > Logs:
 gateway_http events for one device; device ID and email redacted.
SELECT EdgeStartTimestamp, RequestHeaders, RayID, ClientRequestHost, ClientRequestPath, EdgeResponseStatus, SecurityAction
FROM http_requests
WHERE requestheaders."x-gateway-device" = '<DEVICE_ID>'
LIMIT 100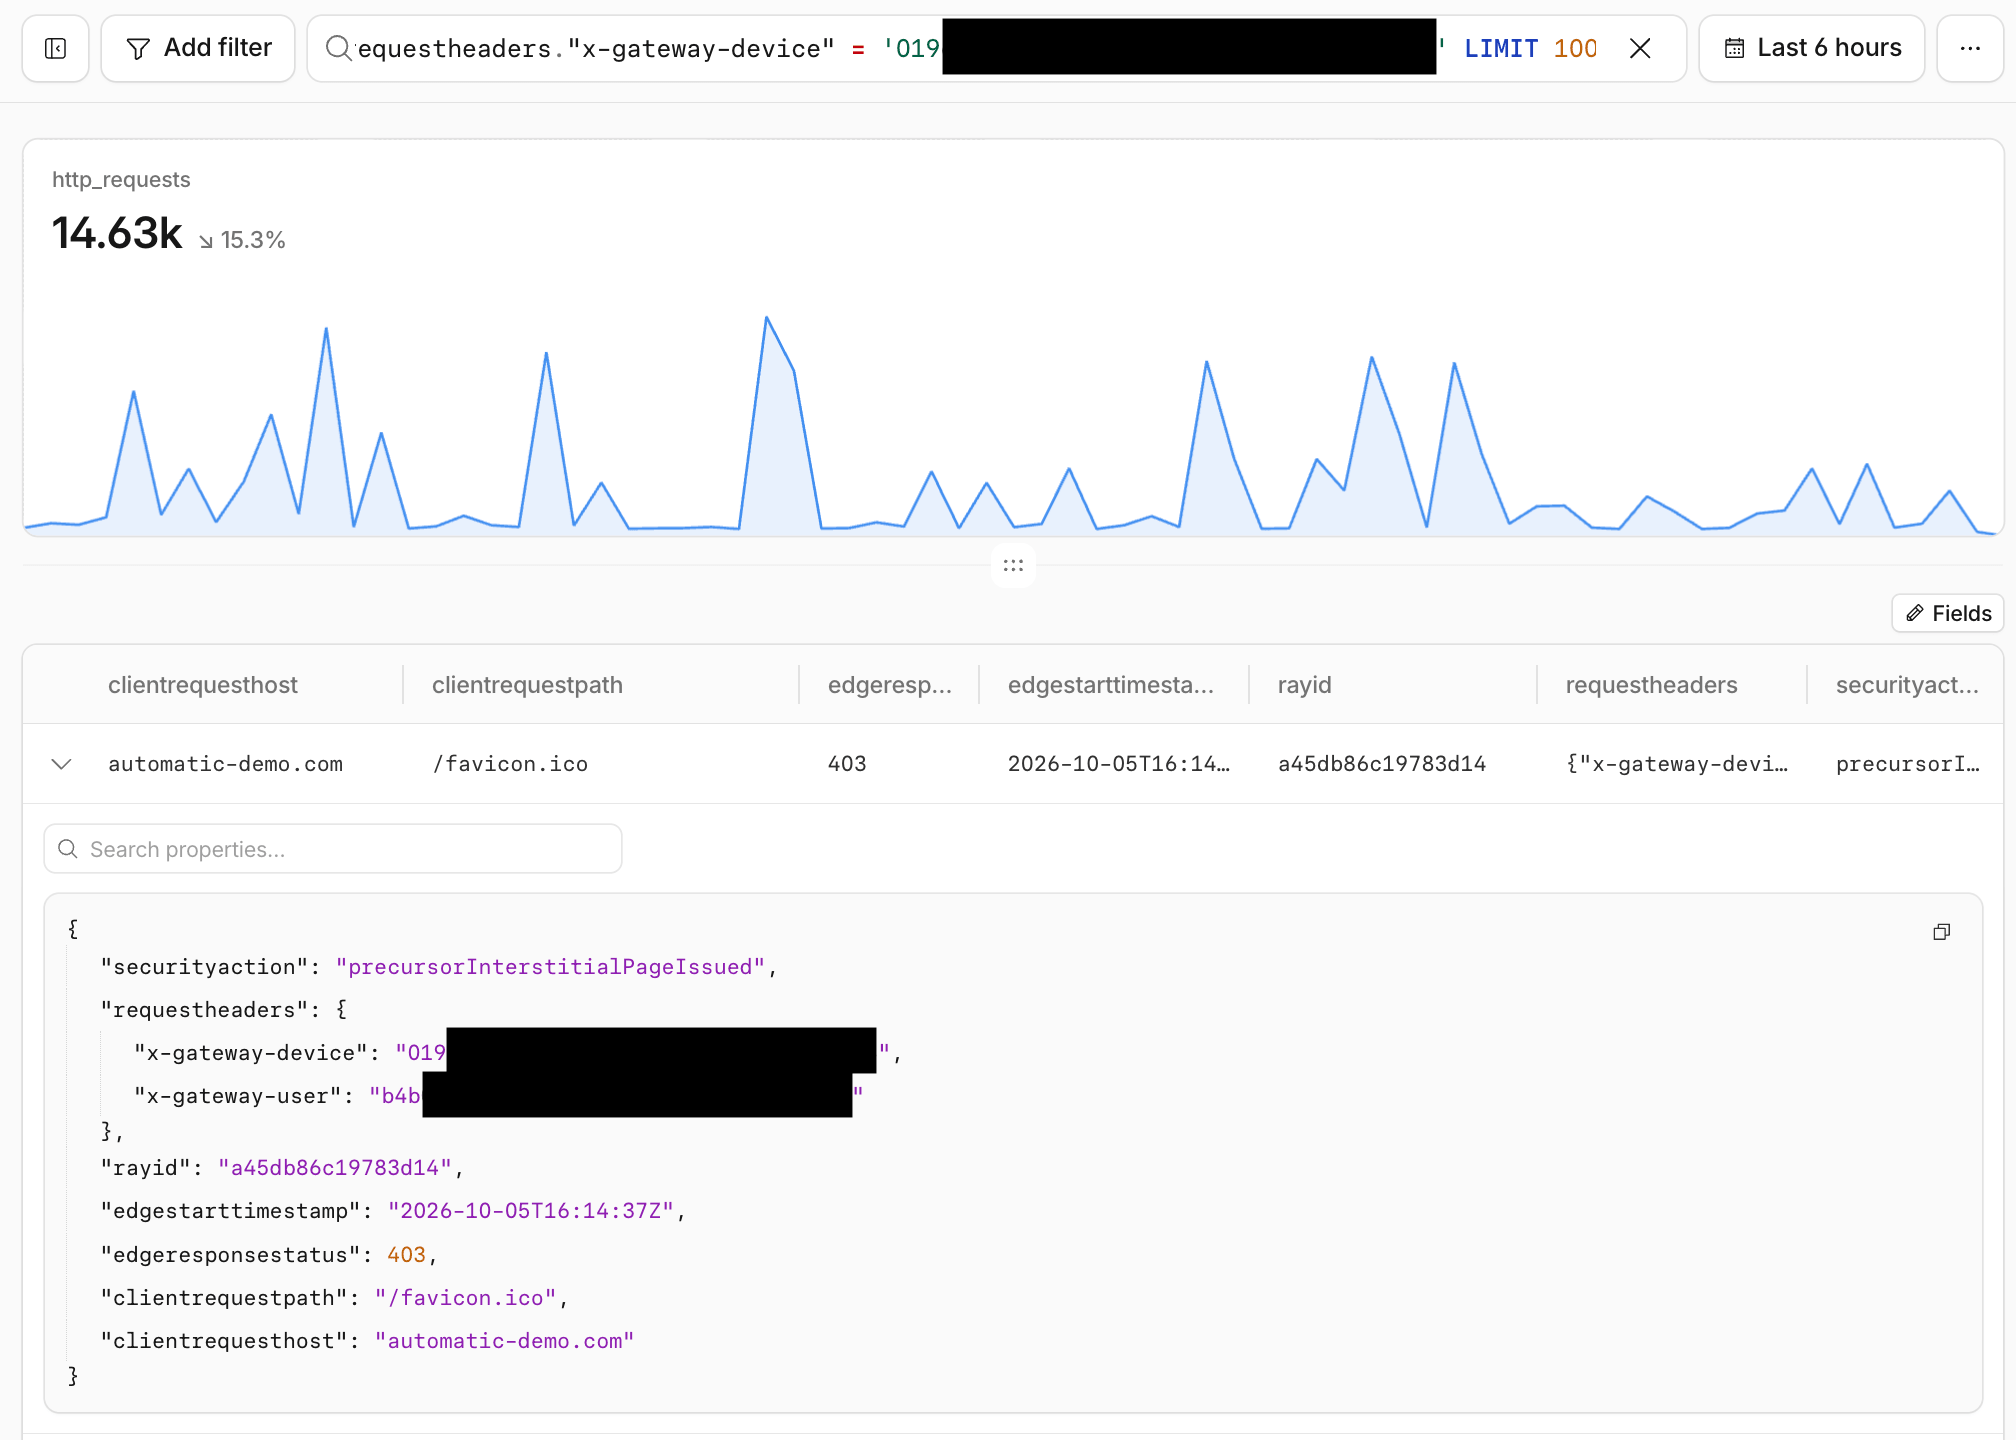 Cloudflare dashboard, Observability > Logs: the same request in the zone’s
 http_requests, matched on the x-gateway-device header; IDs redacted.
DeviceID is empty for traffic that does not come through the Cloudflare One Client, such as clientless Browser Isolation. For that traffic, use the x-gateway-user header (the user’s Cloudflare identity UUID) and compare it with the UUID in UserID.
Keep the policy limited to hostnames you control, so identifiers are not sent to third parties. If Gateway cannot resolve a dynamic value, it sends a placeholder such as cf-unresolved and adds a warning to the HTTP log.
Cloudflare One Client Issues (DEX)
Digital Experience Monitoring is included in all Zero Trust plans. Start in Zero Trust > Insights & Logs > Digital experience.
| QUESTION | WHERE |
|---|---|
| Is it one user or everyone? | Device overview: connection status and devices per Cloudflare data center |
| Is it the device, the network or the app? | Device monitoring and synthetic tests (HTTP, traceroute) |
| What happened on the device? | Diagnostics > remote captures: packet captures and device diagnostic logs (last 96 hours) from up to 10 devices (Windows, macOS, Linux) |
| What does the diagnostic log say? | Select the capture > View Device Diag: the diagnostics analyzer shows an AI summary, detection events and device details |
| What did Gateway do with the traffic? | Insights & Logs > Logs: DNS query logs, Network logs and HTTP request logs |
| History beyond the dashboard, or in a SIEM | Log Explorer or Logpush: dex_application_tests, dex_device_state_events, warp_toggle_changes, warp_config_changes, device_posture_results, zero_trust_network_sessions, ssh_logs, mcp_portal_logs, biso_user_actions, casb_findings, access_requests, gateway_*, dlp_forensic_copies, email_security_*, ipsec_logs |
Dashboard retention can be short. Enable Log Explorer datasets or Logpush before you need them.
The DEX MCP server answers questions such as “fetch the DEX test results for user@example.com over the past 24 hours”. Here is a practical example.
Debug Workers with AI Agents
Locally
wrangler dev and vite dev capture OpenTelemetry traces and correlated logs with no setup. Update the Wrangler CLI and Vite plugin.
- Humans: press
ein Wrangler, or open/cdn-cgi/local/explorer. Local Explorer shows logs, traces, and the data in local KV, R2, D1, Durable Objects and Workflows. - Agents: when Wrangler detects an AI agent, it prints the Local Explorer API (
/cdn-cgi/local/explorer/api, with an OpenAPI spec). Traces and logs are queryable with SQL viaPOST /cdn-cgi/local/explorer/api/local/observability/query, so an agent can find the failing span, fix the code, rerun and verify without deploying or addingconsole.log().
In Production
{
  "observability": {
    "enabled": true,
    "logs": { "head_sampling_rate": 1 },
    "traces": { "enabled": true, "head_sampling_rate": 0.05 },
    "issues": { "enabled": true }
  }
}- Workers Logs are on by default for new Workers. Log structured JSON so fields are filterable in the Query Builder.
- Traces instrument fetch, binding, RPC and handler calls automatically.
observability.enabledalone does not turn them on yet. - Issues group uncaught exceptions, failed invocations,
5xxresponses and error logs (Wrangler 4.134.0+). Automations can send an issue straight to a coding agent, webhook, chat or incident tool. - OpenTelemetry export sends logs and traces to Honeycomb, Grafana Cloud, Axiom and others.
Give Your Agent Access
Most people find it easier to ask “which paths returned the most 5xx errors since yesterday’s deploy?” than to write the SQL or GraphQL for it. An agent writes the query, scans thousands of log lines, pivots between datasets and summarizes the pattern far faster than clicking through dashboards, and the same agent can then read the code and propose the fix. Give it read-only, narrowly scoped access, and check important numbers before acting on them.
| TOOL | USE |
|---|---|
| Agent setup | Per-agent guides (Claude Code, Codex, Cursor, …) for Cloudflare Skills and MCP servers |
Observability MCP: https://observability.mcp.cloudflare.com/mcp | Workers logs and analytics |
Code Mode MCP: https://mcp.cloudflare.com/mcp | The whole Cloudflare API through one server |
cf CLI (beta): npm install --global cf | JSON output by default; cf sql query and cf sql datasets |
| Other Cloudflare MCP servers | DEX, Logpush, Audit Logs, DNS Analytics, AI Gateway, Radar |
Other Common Questions
| QUESTION | ANSWER |
|---|---|
| Why was this request blocked? | Domain > Analytics > Security tab, or the Security Events for what Cloudflare acted on, or Observability > Traces for the exact rule. |
| Can I alert on my own query? | Custom Alerts (beta) run a SQL API query on a schedule: threshold, anomaly or SLO. Email and webhooks on all plans, PagerDuty from Business. |
| One dashboard for CDN, WAF and Workers? | Custom Dashboards combine analytics, Log Explorer and Workers Observability logs and traces; up to 100 per account. |
| Can my app show its own analytics? | The Analytics SQL binding (ANALYTICS_SQL, Wrangler 4.145.0+) queries the SQL API from a Worker without an API token. Log Explorer datasets are not supported through it. |
| Logs into my SIEM? | Logpush on all plans. Transformers filter, reshape and redact with SQL. Logpush cannot backfill, so subscribe to the Failing Logpush Job Disabled alert and query job health with logpushHealthAdaptiveGroups in GraphQL. The billed volume (uncompressed bytes delivered) is billableBytes in the account-level logpushUsageAdaptiveGroups. |
| Usage for DNS, Images or Stream? | DNS: dnsAnalyticsAdaptiveGroups in GraphQL, per account or zone (see Account-Wide Weekly Totals). Images: self-serve plans bill unique transformations per month, plus images stored and delivered; imagesTransformationsAdaptiveGroups and imagesUniqueTransformationsAccumulatedSinceStartOfMonth in GraphQL estimate them. The Images usage statistics API only counts stored images. Stream: minutes stored from the storage usage API, minutes viewed from streamMinutesViewedAdaptiveGroups. |
| Usage for R2, D1 or KV? | Account-level GraphQL datasets: r2StorageAdaptiveGroups and r2OperationsAdaptiveGroups (group by actionType to split Class A and B), d1AnalyticsAdaptiveGroups (rowsRead, rowsWritten) and kvOperationsAdaptiveGroups. Add them as aliases to the weekly totals query. |
| Is Cloudflare having an incident? | Cloudflare Status, and the Cloudflare Status notification for email or webhook alerts. |
Disclaimer
For informational purposes only. Features, availability and pricing change; the Cloudflare documentation is the reference.
Numbers from analytics, logs and the queries in this post help with monitoring and planning, but they are not billing records. Discuss billing questions directly with your Cloudflare account team or Cloudflare Support: your invoice and Cloudflare’s billing systems are authoritative.
This blog post is independent and not affiliated with, endorsed by, or necessarily reflective of the opinions of Cloudflare or any other entities mentioned. Screenshots are taken from the Cloudflare Dashboard of my own account.
This blog post was partially drafted and refined with AI assistance.